

Factors..5 min read
Which value? The rule is the product
Two flagship value indexes on the same market share only 75 to 80 percent of their weight, and Asness and Frazzini found 3 to 3.8 points a year in one input: which price you read.
By Tanmay Kurtkoti, founder of QC Alpha and builder of RupeeCase
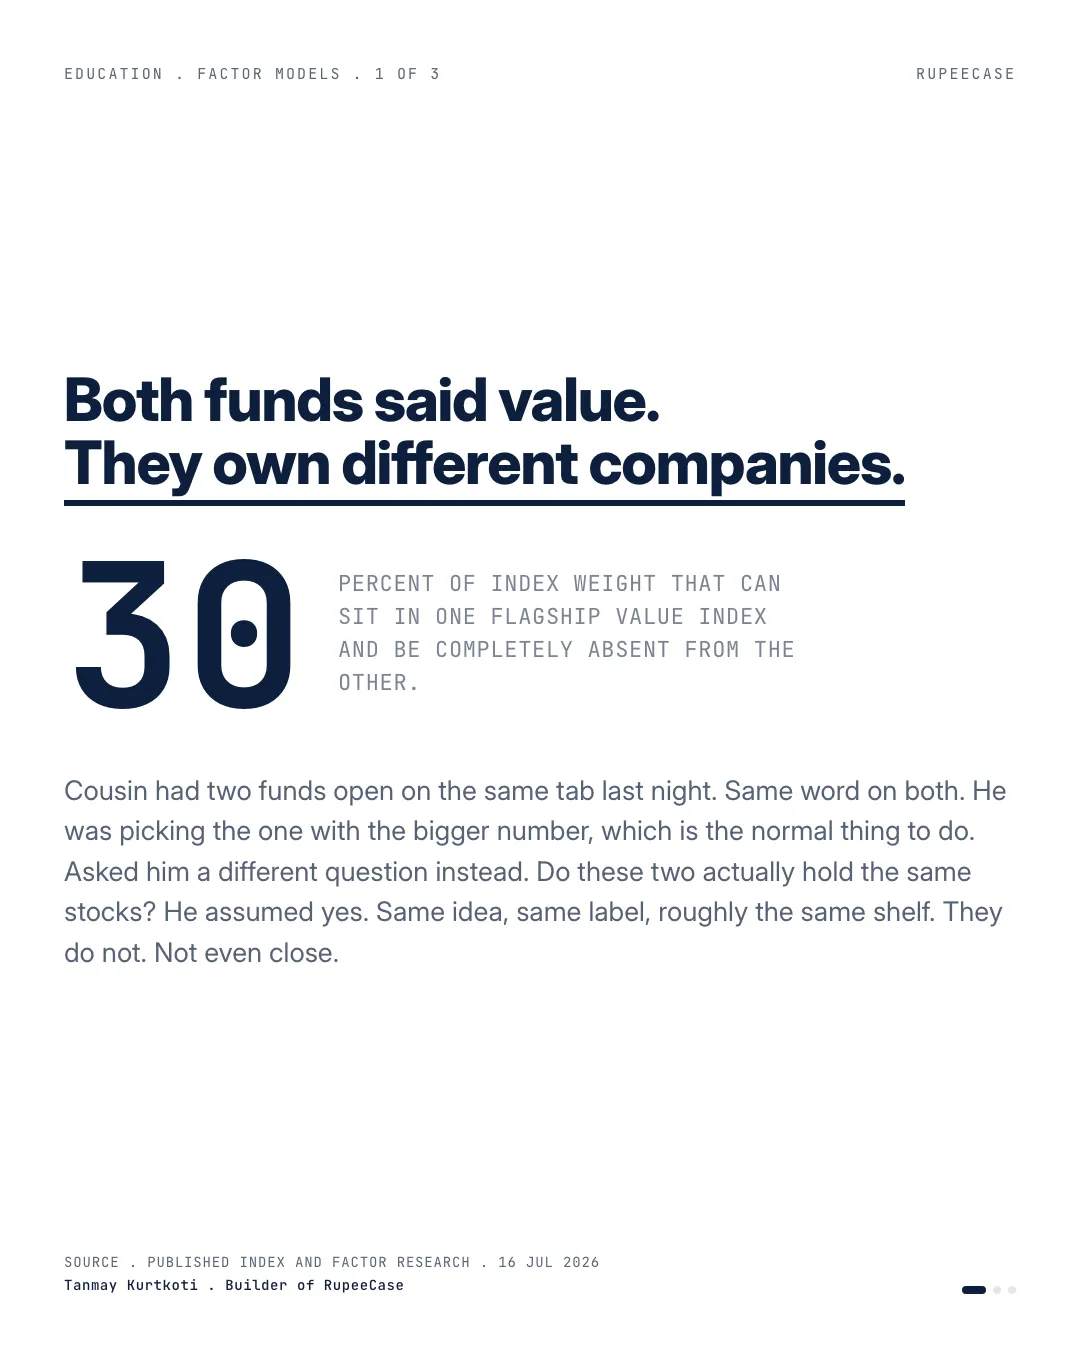
Cousin had two funds open on the same tab last night. Both said value. He was picking the one with the bigger number, which is the normal thing to do and the reason I bothered saying anything.
Asked him something else instead. Do these two actually hold the same stocks?
He assumed yes. Same word, same idea, same shelf. Reasonable assumption. Also wrong.
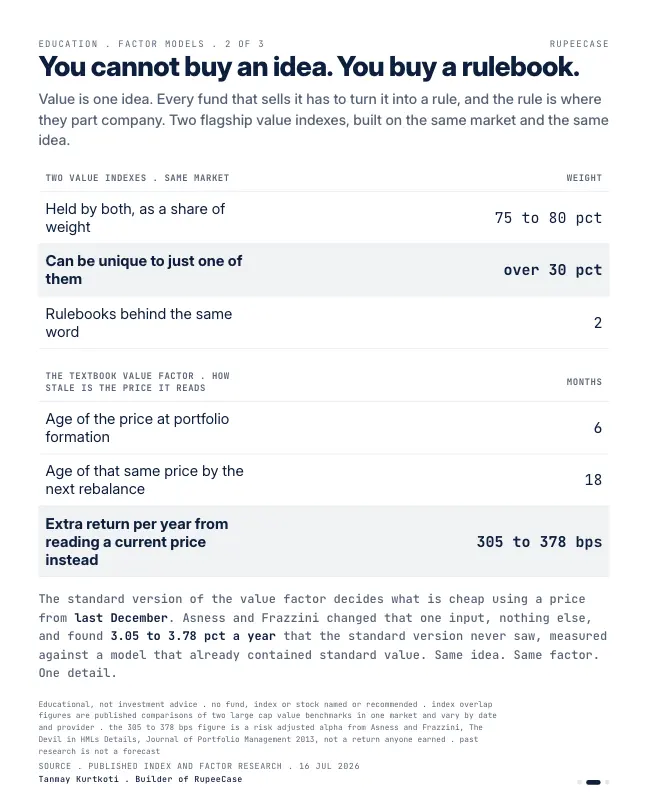
Take two flagship value indexes built on the same market. Roughly 75 to 80 pct of their weight is common. The rest is not, and more than 30 pct of index weight can sit in one and be completely absent from the other. Not because anyone is being dishonest. One rulebook penalises forecast earnings growth, the other scores each company against its own sector peers. Both are defensible. They disagree anyway, because they were always going to.
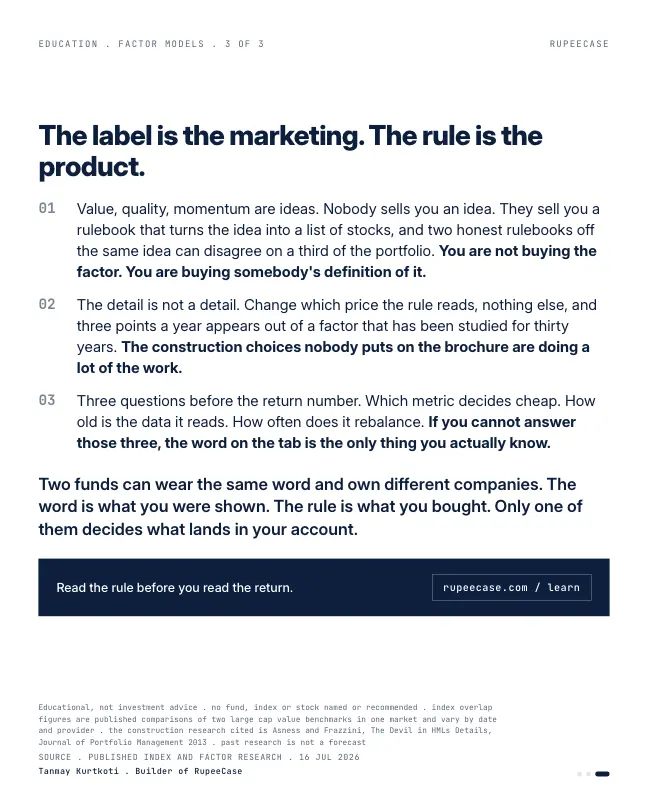
Here is the part nobody tells you. Value is an idea. Nobody sells you an idea. They sell you a rulebook that turns the idea into a list of stocks, and every choice inside that rulebook is doing work you never see.
How much work? The textbook value factor, the one thirty years of research is built on, decides what is cheap using a price from last December. Six months old when the portfolio gets built. Eighteen months old by the next rebalance. Asness and Frazzini changed that one input to a current price, left everything else alone, and found 3.05 to 3.78 pct a year of risk adjusted return that the standard version had been walking past. Measured against a model that already contained standard value.
One detail. Not a fee, not a manager, not a market call. Which price you read.
So the useful question was never whether value works. It is whose value, built which way. Three things to ask before the return number: which metric decides cheap, how old is the data it reads, how often does it rebalance.
The label is the marketing. The rule is the product.
What cheap looks like on an NSE factsheet
Start with what a value rule actually buys. NSE publishes the valuation of each index on its factsheet. Here is its large and mid cap value index next to the Nifty 50 on the same day.
Nifty200 Value 30 P/E, against 19.36 for the Nifty 50
NSE Indices factsheets, 30 Sep 2026
its P/B, against 2.78 for the Nifty 50
NSE Indices factsheets, 30 Sep 2026
its dividend yield, against 1.22% for the Nifty 50
NSE Indices factsheets, 30 Sep 2026
On every one of these measures the value index is about half the price of the market, or pays nearly twice the yield. But each measure ranks individual companies differently. A rule that sorts on earnings and a rule that sorts on book value will agree on the obvious names and disagree at the edges. The edges are where the two funds in the opening part ways.
Same idea, different list: a worked example
Take two made up companies. Company A trades at 8 times earnings and 3 times book: it earns a lot on a small asset base. Company B trades at 16 times earnings and 0.9 times book: heavy assets, thin profits this year. A rule that decides cheap by P/E holds Company A. A rule that decides cheap by P/B holds Company B. Both rules are value. They hold different stocks.
Scale that up and you get the overlap in the opening. If 78 percent of the weight is common, the two funds can only differ through the other 22 percent. But that 22 percent can still make a large gap. Say the stocks only fund one holds return 18 percent in a year and the stocks only fund two holds return 8.
Two funds with the same label and four fifths of the same stocks, 2.2 points apart in one year. Over five years of gaps like that, the "bigger number" my cousin was choosing on is mostly the rulebook, not the idea.
How a December price goes stale
The second lever in the opening is the age of the price. The textbook build reads book value and price at the end of December, then forms the portfolio at the end of June and holds it for a year.
Here is why that matters. Say Company B has book value of Rs 100 a share. In December it traded at Rs 120, a P/B of 1.2. By June it has fallen to Rs 80, a P/B of 0.8. The December rule still sees 1.2 and may pass it over. A rule reading the current price sees 0.8 and holds it. Same company, same book, same idea of value. The only difference is the date on the price, and the research in the opening put a figure of 3.05 to 3.78 percent a year on that one choice.
- Which metric decides cheap?Earnings, book, sales, dividends, or a blend, and whether it is compared within each sector.
- How old is the data?A price from last December or from the day the list is built.
- How often does it rebalance?Once a year lets the list drift. More often keeps it closer to the rule.
The free module on the value factor compares the main value metrics and their limits in Indian markets. Value's long dry spells are in factor winters, and the stocks a cheapness screen should not hold are in the value trap post.
Questions readers ask
Why do two value funds give different returns?
Because each follows its own rulebook. They may decide cheapness by different measures, read prices of different ages and rebalance on different schedules. Even with 78 percent of weight in common, a 10 point gap between the stocks they do not share becomes a 2.2 point gap between the funds.
Which metric is best for value investing, P/E or P/B?
Each has blind spots. P/E misses companies with a temporary profit dip, and P/B misses businesses that earn well on few assets. Many rules blend several measures. On 30 Sep 2026 the Nifty200 Value 30 traded at a P/E of 8.86 and a P/B of 1.21, both well under the Nifty 50.
Does it matter how old the price in a value screen is?
Yes. A price from last December can be six to eighteen months old by the time the portfolio holds it, so the rule can miss stocks that became cheap since then. Research that switched to a current price found 3.05 to 3.78 percent a year of extra risk adjusted return.
The cards
3 cards. Swipe, or tap to open.
Explore next
Learn it properly, then see it applied.
Reading path
Stop 2 of 8 on Factor primer
Related
- Dividend yield: the denominator does the workA 5 percent yield from a crashed price and one from a doubled payout look identical on a screener, and since April 2020 dividends are taxed at slab, 31.2 percent at the top.Factors . . 11 min
- Factor winters: the premium is pay for the droughtValue went flat to negative from 2007 to 2020 with a drawdown near 55 percent, and that discomfort is the reason the premium has not been arbitraged away.Factors . . 5 min
- Cheap for a reason: value or trapThe cheapest Nifty 500 names split by free cash flow trend compounded at 14.6 percent and 3.2 percent over a decade, from the same doorway.Factors . . 5 min
Educational content only. Figures are illustrative and computed on historical or representative data for teaching purposes, not investment advice. Past performance does not guarantee future returns. Sourced from NSE, BSE, SEBI, AMFI and RBI public data.