

Factors..5 min read
Factor winters: the premium is pay for the drought
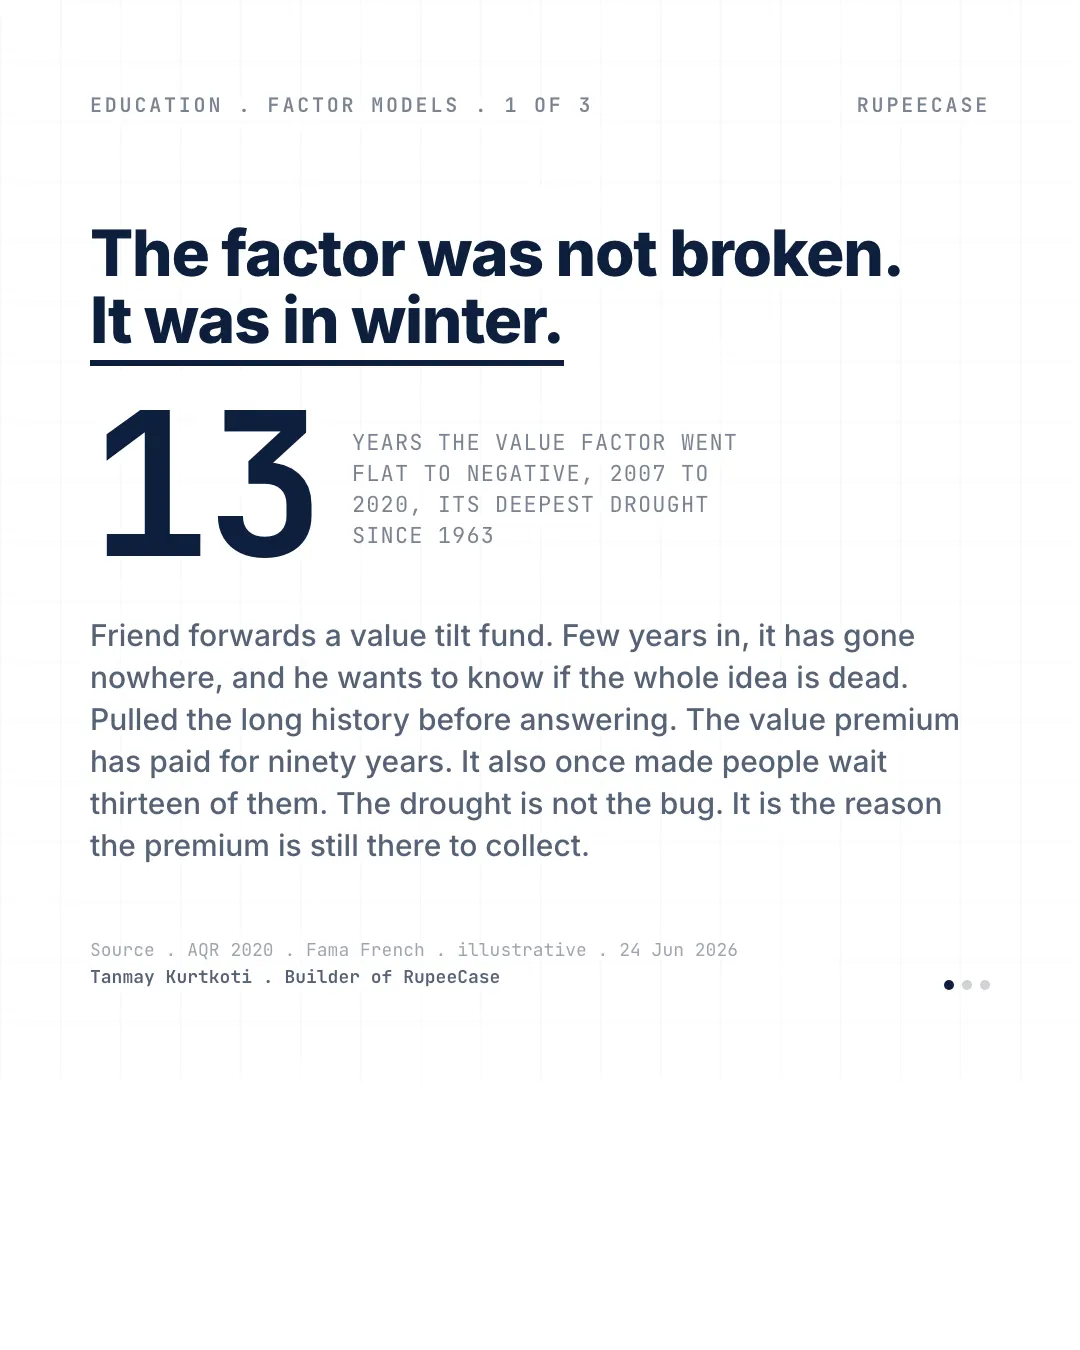
Value went flat to negative from 2007 to 2020 with a drawdown near 55 percent, and that discomfort is the reason the premium has not been arbitraged away.
By Tanmay Kurtkoti, founder of QC Alpha and builder of RupeeCase
A friend forwarded me a value tilt fund last week. Few years in, it had gone nowhere, and he wanted to know if the whole idea was broken.
I pulled the long history before answering.
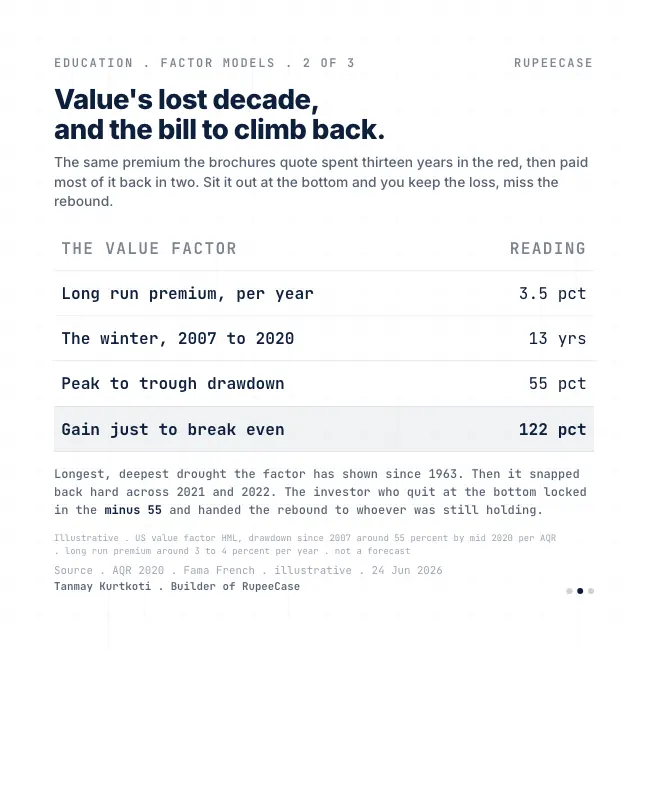
Value, measured as a factor, went flat to negative from 2007 all the way to 2020. Thirteen years. At the bottom, the drawdown was somewhere around 55 percent. That is the deepest and longest drought the factor has shown since 1963. Every smart beta brochure still quotes the long run premium, around three to four percent a year. Almost none of them quote the thirteen year wait that came attached to it.
Here is the part that catches people. A 55 percent hole needs a 122 percent gain just to climb back to flat. Value did recover, sharply, across 2021 and 2022. But whoever gave up at the bottom locked in the loss and handed the entire rebound to whoever was still holding.
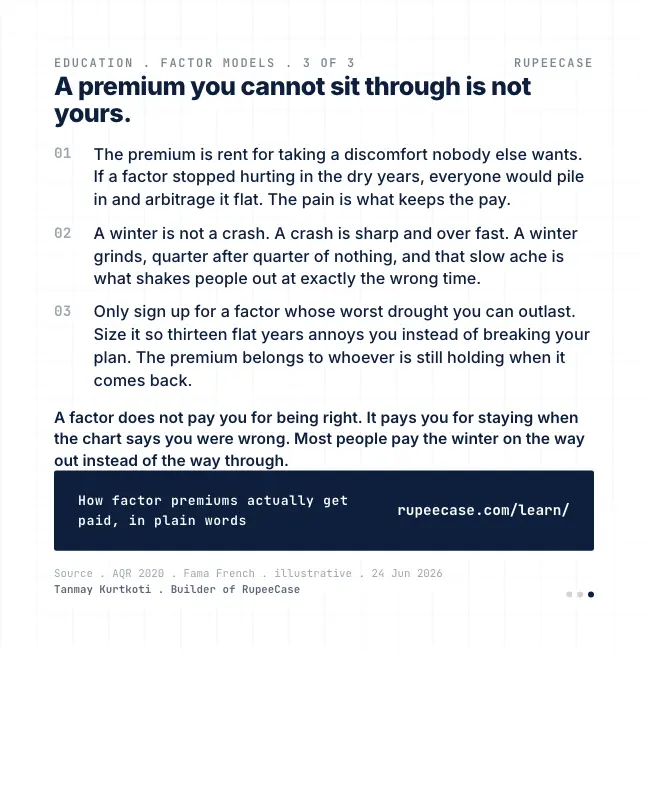
What took me a while to really get is that the drought is not a flaw in the factor. It is the reason the factor pays at all. If a premium stopped hurting in the dry years, everyone would crowd in and arbitrage it flat. The discomfort is the toll. You are being paid to hold the thing other people cannot stomach holding.
A winter is different from a crash too. A crash is sharp and over fast. A winter just grinds, quarter after quarter of nothing, and that slow ache is what shakes investors out at exactly the wrong moment.
So before you buy any factor, ask one question. Can I sit through its worst winter without selling. Size it so a flat decade annoys you instead of breaking your plan.
A factor does not pay you for being right. It pays you for staying when the chart says you were wrong.
The arithmetic of a hole
The 122 percent in the opening is not a typo. A fall and the gain needed to undo it are not the same size, because the gain is measured from the lower base. Lose 55 percent and Rs 1,00,000 becomes Rs 45,000. To get back to Rs 1,00,000 you need Rs 55,000 more, and Rs 55,000 on a base of Rs 45,000 is 122 percent.
The time it takes depends on the pace of the climb. At 10 percent a year, a steady rate chosen for the arithmetic, that climb takes about 8.4 years. At 15 percent, about 5.7.
Try 30.7, the deepest fall of an Indian factor index in the last two years, which comes up below. It needs 44.3 percent to recover. Smaller hole, same shape of problem.
Indian factors are in a winter right now
This is not only a story about US value between 2007 and 2020. Look at NSE's own factor indices over the two years to 9 Oct 2026, price only.
- Nifty200 Value 300.9%
- Nifty 500-7.3%
- Nifty100 Low Vol 30-10.1%
- NIFTY200 Quality 30-17.5%
- Nifty200 Momentum 30-21.5%
Price change over the two years to 9 Oct 2026, from NSE index closes. Before dividends. Index history, not a forecast.
The Nifty200 Momentum 30 fell 30.7 percent from its high to its low inside those two years, and on 9 Oct 2026 it was still 21.5 percent below where it started. Quality is the slower case, the true winter. On NSE's factsheets for 30 Sep 2026 the NIFTY200 Quality 30 earned 6.40 percent a year on total return over five years, against 8.30 for its parent Nifty 200. Since April 2005, back calculated years included, the same index shows 16.64 percent against 13.46. A long run lead, and a five year stretch of trailing inside it.
That is what a winter looks like from the inside. No single terrible day. Just a factor that keeps finishing behind the plain index, year after year, while the long run number on the factsheet still looks fine.
Crash or winter: why the second one does more damage
The opening draws the line between the two. Here it is side by side.
Sharp, loud and short
- Everything falls together, so it does not feel personal
- It is on the news, so you know why
- Recoveries often start within months
Quiet, slow and long
- Your factor lags while the index does fine
- No headline explains it, so it feels like a mistake
- It can run for five years or, in the US value case, thirteen
A crash tests nerve for a few weeks. A winter tests belief for years, and belief is what gives way first. The investor who sells in a winter rarely sells at a dramatic low. They sell after the third flat year, when the reason for holding stops feeling true.
The free module on factor timing and cycles goes through why these cycles run long and irregular, and why exiting after two bad years has historically meant missing the payoff. For the value side, which value you hold changes how deep the winter gets, and the value trap post covers the stocks that are cheap for a reason.
Questions readers ask
How much does a stock need to gain after a 50 percent fall?
It needs 100 percent to break even, because the gain is measured from the lower price. A 30 percent fall needs about 43 percent, and a 55 percent fall needs about 122 percent. The formula is 1 divided by (1 minus the fall), minus 1.
Why do factor premiums have long periods of underperformance?
A premium that never hurt would attract so much money that it would be competed away. The long flat stretches are the cost that keeps the premium alive. In India, the NIFTY200 Quality 30 trailed the Nifty 200 by 1.9 points a year over the five years to 30 Sep 2026 while still leading since 2005.
Is a factor broken if it has lagged for three years?
Three years is short for a factor. US value ran flat to negative from 2007 to 2020 before a sharp recovery. A lag alone does not tell you the factor is broken; whether the economic reason behind it still holds is the more useful question.
The cards
3 cards. Swipe, or tap to open.
Explore next
Learn it properly, then see it applied.
Related
- Which value? The rule is the productTwo flagship value indexes on the same market share only 75 to 80 percent of their weight, and Asness and Frazzini found 3 to 3.8 points a year in one input: which price you read.Factors . . 5 min
- Dividend yield: the denominator does the workA 5 percent yield from a crashed price and one from a doubled payout look identical on a screener, and since April 2020 dividends are taxed at slab, 31.2 percent at the top.Factors . . 11 min
- Cheap for a reason: value or trapThe cheapest Nifty 500 names split by free cash flow trend compounded at 14.6 percent and 3.2 percent over a decade, from the same doorway.Factors . . 5 min
Educational content only. Figures are illustrative and computed on historical or representative data for teaching purposes, not investment advice. Past performance does not guarantee future returns. Sourced from NSE, BSE, SEBI, AMFI and RBI public data.