

Factors..5 min read
Cheap for a reason: value or trap
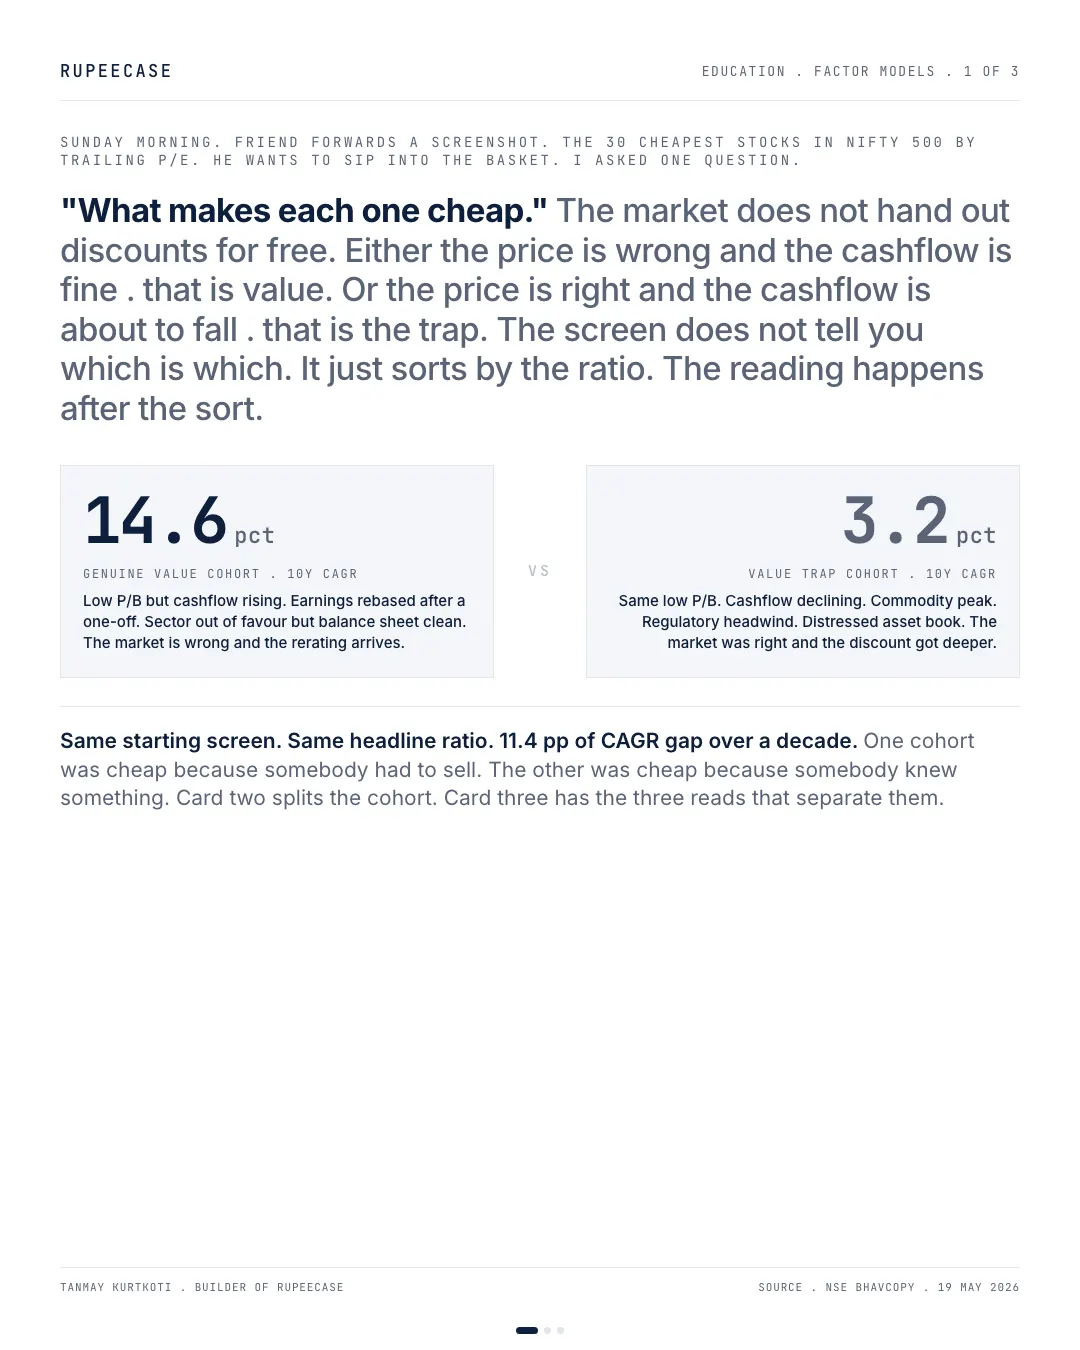
The cheapest Nifty 500 names split by free cash flow trend compounded at 14.6 percent and 3.2 percent over a decade, from the same doorway.
By Tanmay Kurtkoti, founder of QC Alpha and builder of RupeeCase
Sunday morning. A friend forwards a screenshot. The 30 cheapest stocks in Nifty 500 sorted by trailing P/E. He wants to SIP the basket and let the discount close.
I asked one question. What makes each one cheap.
The screen does not answer that. Some of those stocks are cheap because the market is wrong about a fixable problem . one-off charge, working capital reset, sector temporarily out of favour. The cashflow is fine and the earnings rebase higher. That is value. Other stocks on the same screen are cheap because the market is right . commodity peak unwinding, regulatory cap arriving, balance sheet quietly funding the dividend. That is the trap. Same starting ratio. Opposite ending cheque.
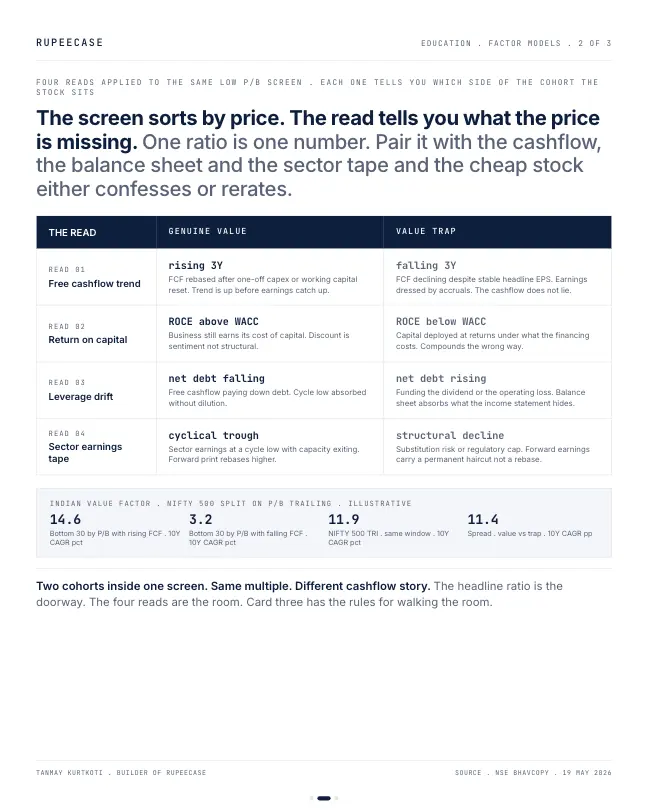
I ran the split. NIFTY 500 sorted by trailing price-to-book. Take the bottom 30 and split it again on whether free cashflow has risen or fallen over the last three years. The rising-FCF half compounded at 14.6 pct CAGR over a decade. The falling-FCF half at 3.2 pct. The index itself did 11.9 pct over the same window. The doorway looked identical. The room was 11 percentage points apart.
Four reads do the separation. Free cashflow trend over three years. Return on capital versus the cost of capital. Net debt drifting up or down. Sector earnings tape at a cyclical trough or a structural cliff. Walk those four lines and the screen confesses.
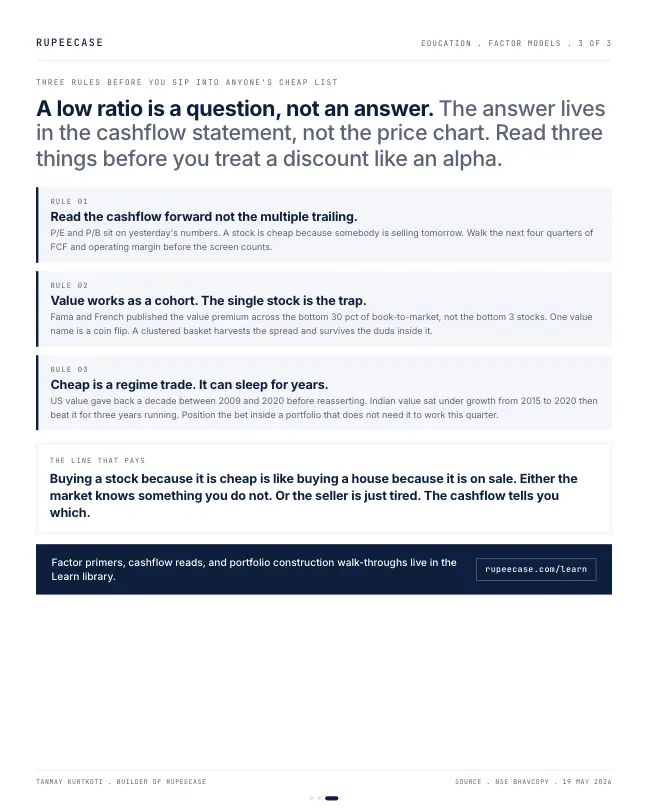
Three things to hold while you walk them. Read the cashflow forward, not the multiple trailing. Value works as a cohort, not a single stock . Fama and French published the premium across the bottom 30 pct of book-to-market, not the bottom three names. And cheap is a regime trade. US value gave back a decade before reasserting. Indian value sat under growth five years then beat it three. Position the bet inside a portfolio that does not need it to work this quarter.
Buying a stock because it is cheap is like buying a house because it is on sale. Either the market knows something you do not. Or the seller is just tired. The cashflow tells you which.
Two companies at the same P/E
Put the screen's problem on two businesses. Company A and Company B both trade at 8 times trailing earnings and 0.9 times book. Same row on the screenshot. Now walk the four reads.
Cheap because of a fixable problem
- Free cash flow Rs 60, 80, 100 crore over three years
- Return on capital 14 percent against a 12 percent cost
- Net debt down from Rs 400 to Rs 250 crore
- Sector at a cyclical low, demand intact
Cheap because the market is right
- Free cash flow Rs 120, 80, 40 crore over three years
- Return on capital 7 percent against a 12 percent cost
- Net debt up from Rs 300 to Rs 550 crore, partly to pay the dividend
- Product facing a new regulatory cap
Return on capital below the cost of capital is the quiet killer. Company B earns 7 rupees for every 100 it employs while its lenders and shareholders expect 12. Every year it keeps growing, it destroys a little more value. A low P/E on that business is not a discount. It is the market pricing the decline.
Cheap on last year, expensive on the next three
A trailing P/E divides today's price by last year's earnings. The trap lives in the gap between last year and the next few. Hold the price still and let earnings move. If Company A grows earnings 10 percent a year, its P/E on year three earnings falls from 8 to 6. If Company B's earnings shrink 20 percent a year, its P/E on year three earnings rises from 8 to almost 16, about the level of the broad market.
That is what the opening means by reading the cash flow forward. The free cash flow trend is the best early clue to which way earnings will move, because cash stops arriving before reported profit falls.
The four reads, in order
- Free cash flow, three yearsCash from operations minus capital spending, from the cash flow statement. Rising or falling?
- Return on capital against its costOperating profit after tax over debt plus equity. Below about 12 percent, growth can destroy value.
- Net debtBorrowings minus cash. Rising debt while the dividend holds steady is the balance sheet funding the payout.
- Sector earnings tapeA cyclical trough recovers. A structural cliff, a cap, a substitute, a lost licence, does not.
What value as a cohort did in India
The opening's point about cohorts shows up in NSE's own value index. The Nifty200 Value 30 holds 30 stocks from the Nifty 200 ranked on value ratios and was launched in June 2024. On its factsheet of 30 Sep 2026 it traded at 8.86 times earnings and 1.21 times book, against 19.36 times earnings for the Nifty 50. Over the five years to that date it returned 22.91 percent a year on total return, against 8.30 percent for the Nifty 200.
P/E of the Nifty200 Value 30
NSE Indices factsheet, 30 Sep 2026
P/E of the Nifty 50
NSE Indices factsheet, 30 Sep 2026
Value 30 total return a year, five years
NSE Indices factsheet, 30 Sep 2026
its price move, six months to 9 Oct 2026
NSE index closes
Then look at the last tile. In the six months to 9 Oct 2026 the same index fell 8.41 percent, the worst of NSE's factor indices over that window. Five years of the best run on the board, followed by the worst half year. That is the regime trade from the opening, live. A cohort spreads the traps across 30 names so no single Company B sinks the basket, but it does not stop the whole style going out of favour for a while.
The free Learn module on the value factor covers the ratios, earnings yield against bond yields and the long value drought, with a quiz. The follow ups on factor winters and which value take the regime and the ratio choice further.
Questions readers ask
What is a value trap?
A value trap is a stock that looks cheap on a ratio such as P/E or price to book but stays cheap or gets cheaper because its earnings keep falling. The low multiple reflects a real decline, not a mispricing. Falling free cash flow, return on capital below its cost and rising debt are the usual warning signs.
How do you tell value from a value trap?
Look forward, not back. Check the three year trend in free cash flow, whether return on capital beats the cost of capital, whether net debt is rising or falling, and whether the sector's problem is cyclical or permanent. A P/E of 8 on earnings that shrink 20 percent a year becomes almost 16 in three years.
Has the value factor worked in India?
Over the five years to 30 Sep 2026 the Nifty200 Value 30 returned 22.91 percent a year on total return against 8.30 percent for the Nifty 200, on NSE's factsheet. It then fell 8.41 percent in the six months to 9 Oct 2026, the weakest factor index over that window.
The cards
3 cards. Swipe, or tap to open.
Explore next
Learn it properly, then see it applied.
Related
- Factor winters: the premium is pay for the droughtValue went flat to negative from 2007 to 2020 with a drawdown near 55 percent, and that discomfort is the reason the premium has not been arbitraged away.Factors . . 5 min
- Which value? The rule is the productTwo flagship value indexes on the same market share only 75 to 80 percent of their weight, and Asness and Frazzini found 3 to 3.8 points a year in one input: which price you read.Factors . . 5 min
- Dividend yield: the denominator does the workA 5 percent yield from a crashed price and one from a doubled payout look identical on a screener, and since April 2020 dividends are taxed at slab, 31.2 percent at the top.Factors . . 11 min
Educational content only. Figures are illustrative and computed on historical or representative data for teaching purposes, not investment advice. Past performance does not guarantee future returns. Sourced from NSE, BSE, SEBI, AMFI and RBI public data.