

Factors..5 min read
The asset growth factor
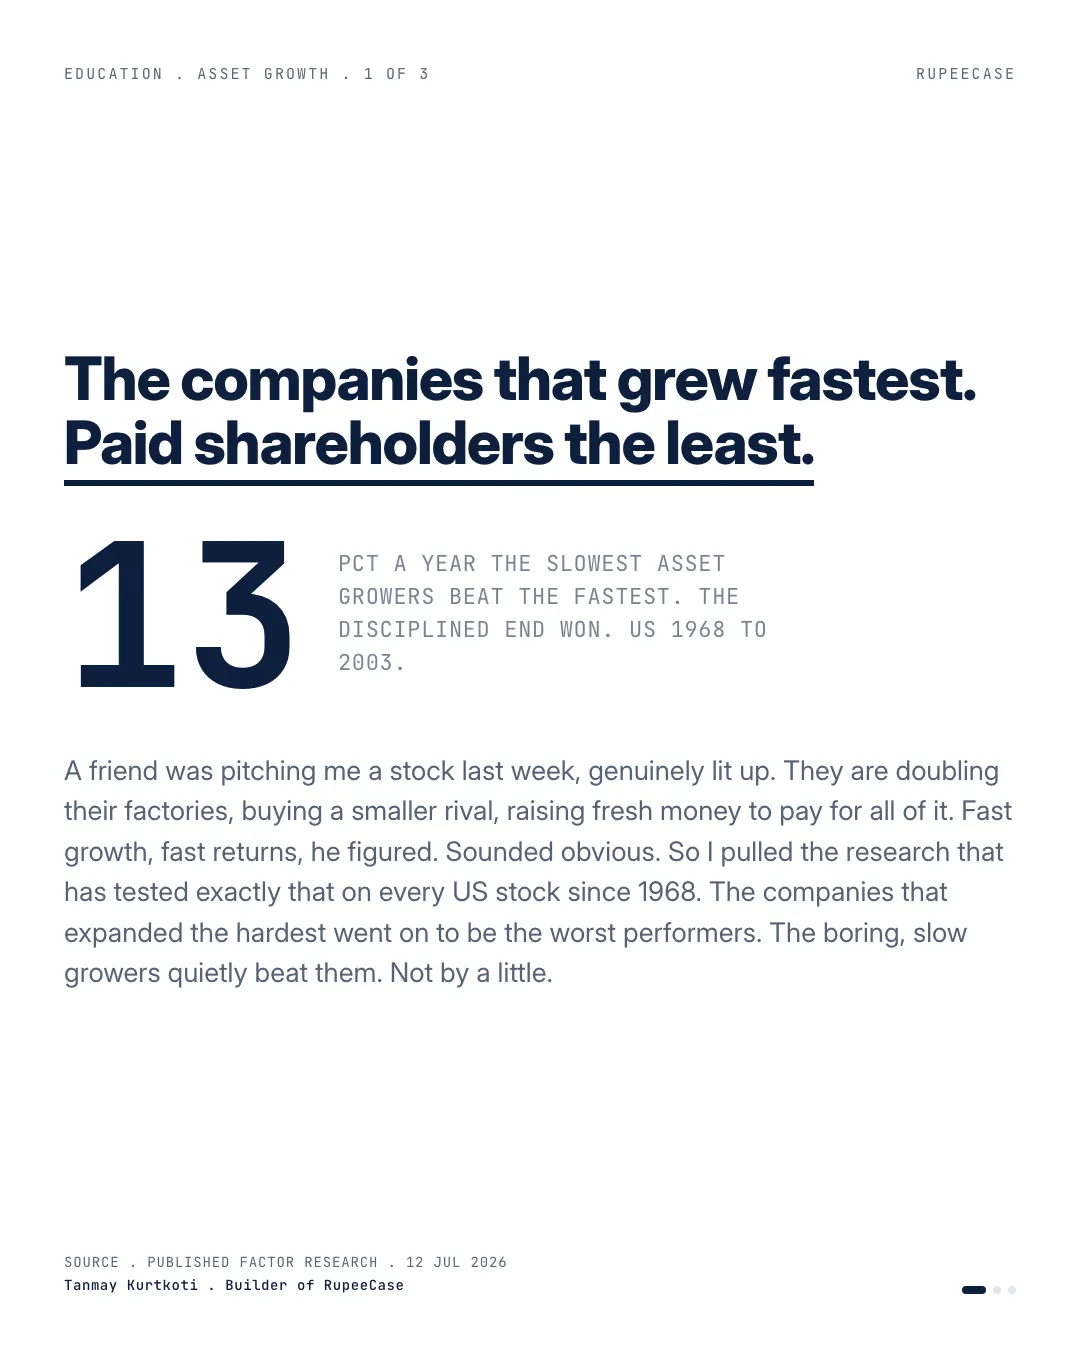
Companies that grew assets slowest beat the fastest expanders by around 13 percent a year over 1968 to 2003, a finding Fama and French wrote into their five factor model.
By Tanmay Kurtkoti, founder of QC Alpha and builder of RupeeCase
A friend was pitching me a stock last week, genuinely excited. They are doubling their factories, buying a smaller rival, raising fresh money to pay for all of it. Fast growth, fast returns, he figured. It sounded obvious.
So I pulled the research that has tested exactly that idea on every US stock going back to 1968.
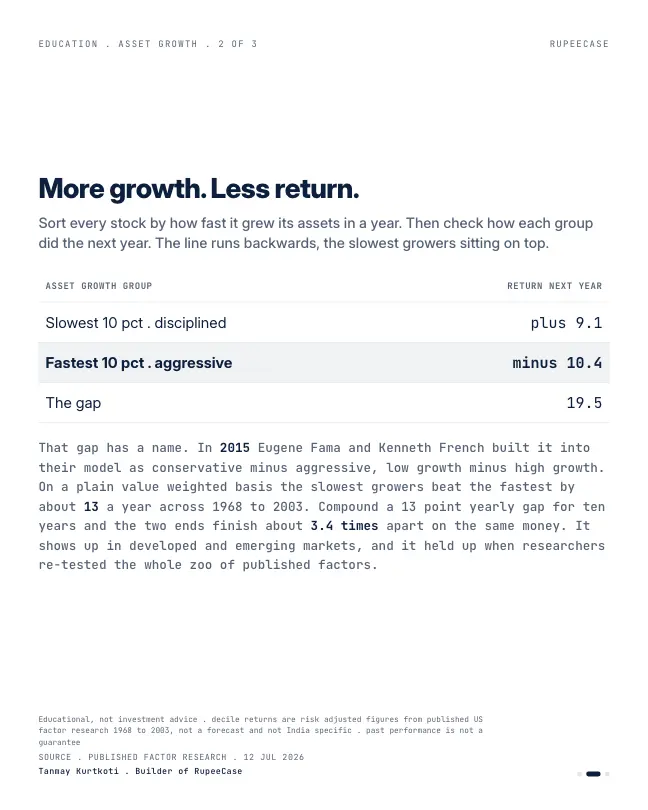
It runs the other way. Sort companies by how fast they grew their assets in a year, then look at how each group did next. The slowest growers, the boring, disciplined end, beat the fastest expanders by around 13 percent a year over 1968 to 2003. The conservative names earned a solid positive return. The aggressive empire builders actually went backwards. Same market, opposite outcomes, decided mostly by how hard each company had spent.
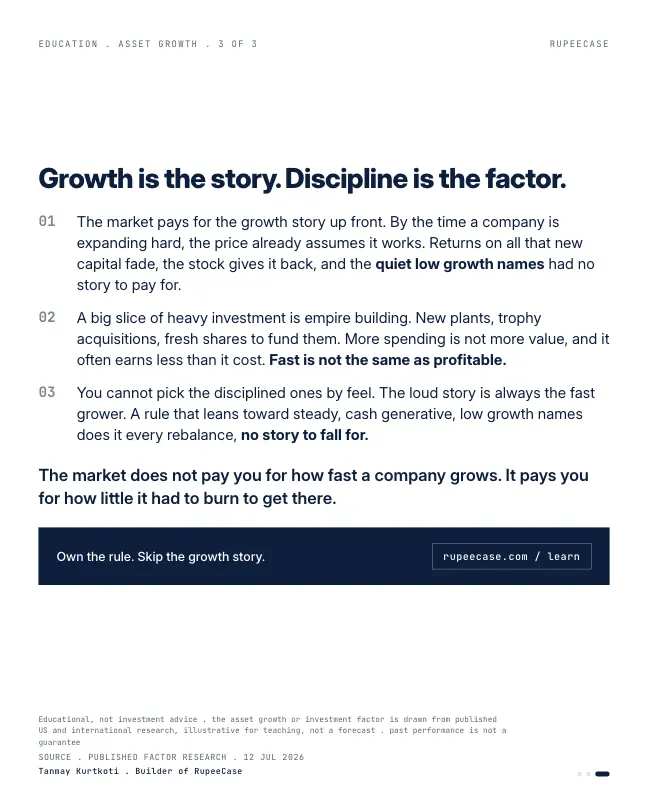
Two things are going on. A large slice of heavy investment is empire building, new plants and trophy acquisitions that earn less than they cost. And by the time a company is visibly expanding hard, the price already assumes it all works, so when the growth fades the stock quietly hands the gains back.
This is not a fringe finding. Eugene Fama and Kenneth French thought it mattered enough to write it into their five factor model in 2015, calling it conservative minus aggressive. It shows up in developed and emerging markets, and it was one of the few effects that survived when researchers went back and re-tested the entire zoo of published factors.
The honest lesson is not that growth is bad. It is that you cannot spot the disciplined companies by feel, because the exciting story is always the fast grower. A rule that leans toward steady, cash generative, low growth names does it every rebalance, with no story to fall for.
The market does not pay you for how fast a company grows. It pays you for how little it had to burn to get there:
How fast growth makes a company worse
Asset growth is one line of arithmetic: total assets this year divided by total assets last year, minus 1. It sounds like a growth number. Read it as a spending number. Every rupee of new assets is a rupee the company had to raise or keep back from shareholders, and it only helps if it earns more than it cost.
Here is a worked example with two made up companies, each starting with Rs 1,000 crore of assets that earn 15 percent, so Rs 150 crore of operating profit a year.
Company A is my friend's pitch. It spends Rs 600 crore on new factories and a rival, raised partly with new shares. Assets grow 60 percent, to Rs 1,600 crore. Say the new assets earn 6 percent, a common fate for a stretched expansion. That adds Rs 36 crore, so profit rises to Rs 186 crore. Profit is up 24 percent, which reads well in a results headline. But the return on assets has fallen from 15 percent to 186 / 1,600 = 11.6 percent.
Company B grows assets 8 percent, Rs 80 crore of new capacity at its usual 15 percent. Profit rises to Rs 162 crore, and the return on assets stays at 15 percent.
Put the return on new assets at 15 and the dilution disappears: Company A becomes a bigger version of itself. Put it at 20 and fast growth adds value. The problem was never growth. It was growth that earned less than the business already did.
- Company B, assets +8%15.0%
- Company A, assets +60%11.6%
Return on assets after one year of expansion. Worked example from the calculator above, not market data.
Now add the second effect from the opening. In the year of the expansion, the price of Company A is usually set by the story, not by the 11.6 percent. When the next few results show the new factories earning 6, the price adjusts down to the business that actually exists. That slow adjustment is the return gap the research measured.
How a rule reads it
A rule does not need to know which expansion will fail. It only needs to measure how hard each company spent, and lean away from the heaviest spenders as a group.
- Read the balance sheetTotal assets this year and last year, from the annual report.
- Work out growthThis year divided by last year, minus 1. Company A: 60 percent. Company B: 8 percent.
- Rank the universeFrom the most conservative to the most aggressive spender.
- Lean low, with other checksCombine with profitability, so slow growth means discipline, not decline.
That last step matters. A company can grow slowly because it is shrinking. That is why asset growth usually sits inside a quality score alongside profitability rather than standing alone. The free module on the quality factor shows how NSE's quality indices combine return on equity, debt and earnings stability, and why quality still has long stretches behind the market. The broader idea is in the quality factor post, and why no single factor can be timed is in factor timing.
MythA company growing its assets fast is a growing business, so its stock should do well.
FactAsset growth is spending. If the new assets earn less than the old ones, profit rises while the return on assets falls, as Company A's did from 15 to 11.6 percent.
Questions readers ask
What is the asset growth anomaly?
It is the finding that companies which grow their total assets slowly have tended to earn higher later returns than companies which grow assets fast. In US data from 1968 to 2003 the gap was around 13 percent a year. Fast expansion often earns less than it costs, and prices tend to assume it will work.
How do you calculate asset growth of a company?
Divide total assets at the end of this year by total assets at the end of last year and subtract 1. A company that goes from Rs 1,000 crore to Rs 1,600 crore of assets has asset growth of 60 percent. Both figures are on the balance sheet in the annual report.
Is low asset growth the same as a value stock?
Not exactly. Low asset growth measures how conservatively a company invests, while value measures how cheap the stock is against earnings or book. The two often overlap, and asset growth sits closer to quality, which is why it is usually combined with profitability checks.
The cards
3 cards. Swipe, or tap to open.
Explore next
Learn it properly, then see it applied.
Related
- Quality: the factor that pays in the bear marketFour spreadsheet screens separate a quality cohort with a 7.4 percent twelve month drawdown from a junk cohort at 38.6, and recovery asymmetry does the rest.Factors . . 5 min
- Factor timing is a rear view mirrorAcross ten years the prior year's leading factor repeated only three times in nine hand offs, while an equal weight blend of five earned about 10.5 percent with a worst year of minus 1.6.Factors . . 5 min
- Which value? The rule is the productTwo flagship value indexes on the same market share only 75 to 80 percent of their weight, and Asness and Frazzini found 3 to 3.8 points a year in one input: which price you read.Factors . . 5 min
Educational content only. Figures are illustrative and computed on historical or representative data for teaching purposes, not investment advice. Past performance does not guarantee future returns. Sourced from NSE, BSE, SEBI, AMFI and RBI public data.