

Factors..5 min read
Quality: the factor that pays in the bear market
Four spreadsheet screens separate a quality cohort with a 7.4 percent twelve month drawdown from a junk cohort at 38.6, and recovery asymmetry does the rest.
By Tanmay Kurtkoti, founder of QC Alpha and builder of RupeeCase
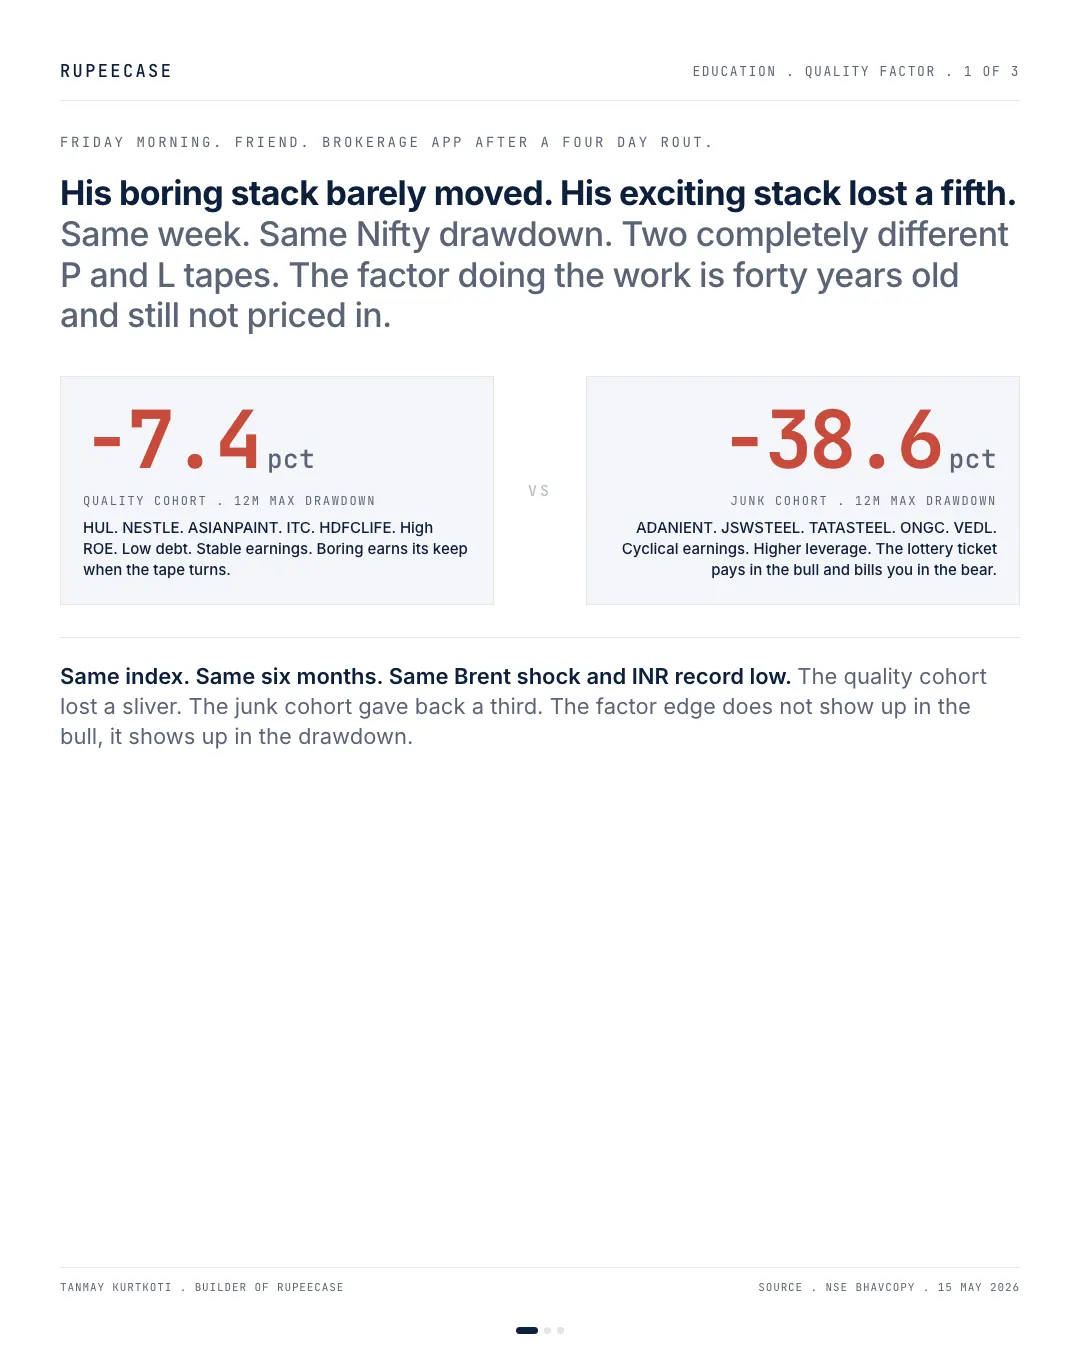
Friend opened his brokerage app on Friday after the four day rout. His boring stack of staples and pharma barely moved. His exciting smallcap and high beta stack lost a fifth. Same week. Same Nifty drawdown. Two completely different P and L tapes. He asked why the boring stack was the calmest. Pulled out the NIFTY 200 split that morning to show him.
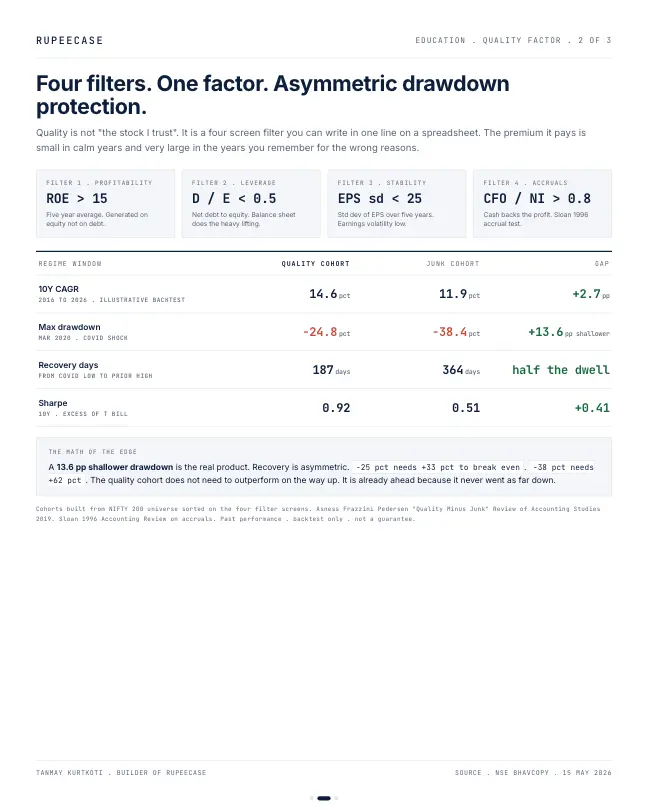
The factor is called quality. Forty plus years old. Still not arbitraged away. Built on four screens you can write in one line of a spreadsheet. Return on equity above fifteen pct. Debt to equity under half. Earnings stability inside one standard deviation. Cash flow from operations backing reported profit at least eighty pct.
Quality cohort by those screens. HUL, NESTLE, ASIANPAINT, ITC, HDFCLIFE. Twelve month max drawdown around seven point four pct.
Junk cohort. The opposite end of the same universe. ADANIENT, JSWSTEEL, TATASTEEL, ONGC, VEDL. Twelve month max drawdown around thirty eight point six pct. Over five times the hole.
Here is the part most people miss. Recovery is asymmetric. Minus twenty five pct needs plus thirty three pct to break even. Minus thirty eight pct needs plus sixty two pct. The quality cohort does not need to outperform on the way up. It is already ahead because it never went as far down. Ten year max drawdown gap of roughly thirteen pp shallower. Recovery dwell half as long. Sharpe almost twice.
Asness, Frazzini and Pedersen wrote the formal Quality Minus Junk paper in Review of Accounting Studies 2019. Sloan flagged the accruals piece back in 1996. The market still has not arbitraged the premium away because retail investors keep paying up for the lottery ticket.
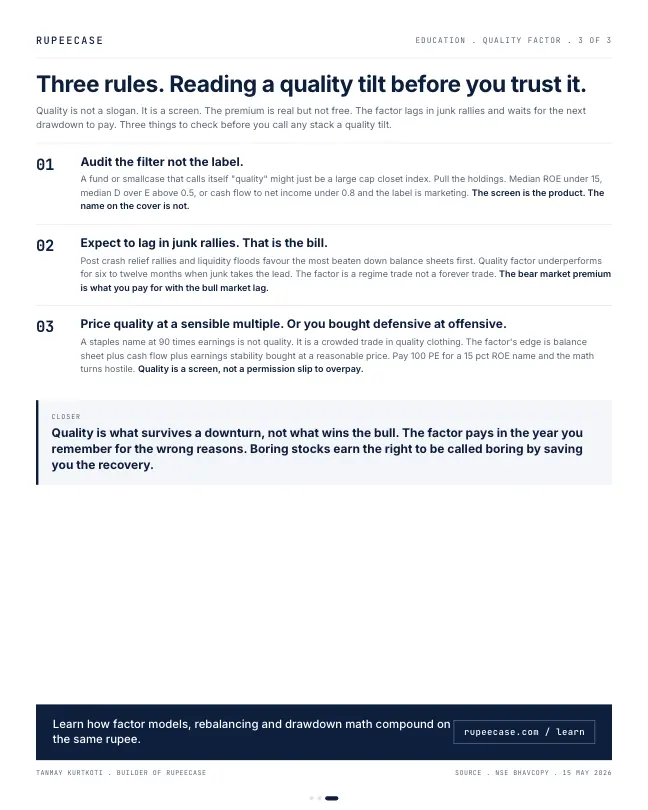
The edge does not show up in the bull. It shows up in the drawdown. Boring stocks earn the right to be called boring by saving you the recovery
The arithmetic of the shallower hole
The recovery rule is one line: the gain needed to break even is the fall divided by what is left. A 7.4 percent fall leaves 92.6, so it needs 7.4 / 92.6, about 8 percent, to get back. A 38.6 percent fall leaves 61.4, so it needs 38.6 / 61.4, about 63 percent. The deeper the hole, the faster the climb back steepens.
gain needed after a 7.4 percent fall
Arithmetic on the opening's cohort figures
gain needed after a 38.6 percent fall
Arithmetic on the opening's cohort figures
So two portfolios that both gain 30 percent in the next good year end in very different places. The shallow one is already above its old high. The deep one is still about 20 percent below it. That is the whole case for quality in one sentence: it wins by losing less.
The four screens, run on Company A and Company B
Here is how the opening's four screens sort two businesses. Company A earns Rs 250 crore on Rs 1,000 crore of equity, a 25 percent return on equity, with Rs 200 crore of debt and Rs 225 crore of operating cash. Company B earns Rs 120 crore on the same Rs 1,000 crore of equity, carries Rs 900 crore of debt and collects only Rs 60 crore of cash.
Passes all four screens
- Return on equity 25 percent, above 15
- Debt to equity 0.2, under 0.5
- Cash from operations 90 percent of profit
- Earnings steady for five years
Fails three of four
- Return on equity 12 percent, below 15
- Debt to equity 0.9, above 0.5
- Cash from operations 50 percent of profit
- Earnings swing with the cycle
NSE runs the same idea as an index. The NIFTY200 Quality 30 picks 30 stocks from the Nifty 200 on return on equity, debt to equity and the stability of earnings growth, and reviews them twice a year. Its five year beta to the Nifty 50 was 0.82 on the NSE factsheet of 30 Sep 2026: it moved less than the market.
The price you pay for the calm
Now the part the opening leaves out. Quality is a good business, not automatically a good price. On 30 Sep 2026 the Quality 30 traded at 25.7 times earnings and 7.93 times book. Price to book divided by price to earnings gives the implied return on equity, about 31 percent, more than twice the Nifty 50's 14 percent at a P/B of 2.78 and P/E of 19.36. Great businesses, priced as such.
- Quality 30, since 200516.64%
- Nifty 200, since 200413.46%
- Quality 30, 5 years6.40%
- Nifty 200, 5 years8.30%
- Quality 30, 1 year-5.42%
- Nifty 200, 1 year-3.23%
Total return. Since inception and 5 year figures are CAGR, back calculated before the 2018 launch; 1 year is absolute. NSE Indices factsheets, 30 Sep 2026.
The starting price explains the recent lag. In the two years to 9 Oct 2026 the Quality 30 fell 17.5 percent on price, against 9.9 percent for the Nifty 50, and its deepest fall from October 2024 was 21.2 percent against 15.6 percent. The defensive factor fell further than the market because it began the period as the crowded, expensive trade.
Here is the same effect on one business. It earns 25 percent on equity and grows profit 12 percent a year. Buy at 20 times and sell at 20 times five years later, and your price return is about 12 percent a year. Buy at 40 times and let the multiple drift to 30, and it falls to about 5.7 percent.
MythQuality stocks are safe at any price.
FactThe NIFTY200 Quality 30 fell 17.5 percent in the two years to Oct 2026 while its businesses kept earning about 31 percent on book. It had started at almost 8 times book.
The free Learn module on the quality factor works through each screen, where to find the numbers in a filing, and when quality itself becomes the crowded trade, with a quiz. The companion posts on momentum and value traps cover the factors quality is most often blended with.
Questions readers ask
What is the quality factor in stock investing?
It is the tendency of profitable, low debt companies with steady earnings to deliver better risk adjusted returns than weak ones. Screens usually combine return on equity, debt to equity, earnings stability and cash conversion. NSE's NIFTY200 Quality 30 applies a version of this to the Nifty 200.
Do quality stocks fall less in a crash?
Often, but not always. Their five year beta of 0.82 on NSE's factsheet of 30 Sep 2026 shows they usually move less than the market. When quality starts expensive, it can fall more: the Quality 30 dropped 21.2 percent at worst from Oct 2024, against 15.6 percent for the Nifty 50.
How much gain is needed to recover from a drawdown?
Divide the fall by what is left. A 25 percent fall needs about 33 percent to recover, a 38.6 percent fall about 63 percent, and a 50 percent fall needs 100 percent.
The cards
3 cards. Swipe, or tap to open.
Explore next
Learn it properly, then see it applied.
Reading path
Stop 3 of 8 on Factor primer
Related
- The asset growth factorCompanies that grew assets slowest beat the fastest expanders by around 13 percent a year over 1968 to 2003, a finding Fama and French wrote into their five factor model.Factors . . 5 min
- Momentum factor primerMomentum means ranking on twelve months with the latest month skipped, a premium of about four points a year in India, paid out lumpy and interrupted by three crashes.Factors . . 6 min
- Cheap for a reason: value or trapThe cheapest Nifty 500 names split by free cash flow trend compounded at 14.6 percent and 3.2 percent over a decade, from the same doorway.Factors . . 5 min
Educational content only. Figures are illustrative and computed on historical or representative data for teaching purposes, not investment advice. Past performance does not guarantee future returns. Sourced from NSE, BSE, SEBI, AMFI and RBI public data.