

Portfolio construction..6 min read
Rebalance cadence: the latency nobody reads
The same thirty names rebalanced quarterly and fortnightly landed at 30.2 and 33.8 percent CAGR over five years, because drift is a silent overweight.
Illustrative: the quarterly against fortnightly comparison in this note is a worked illustration on sample figures, not a published back test.
By Tanmay Kurtkoti, founder of QC Alpha and builder of RupeeCase
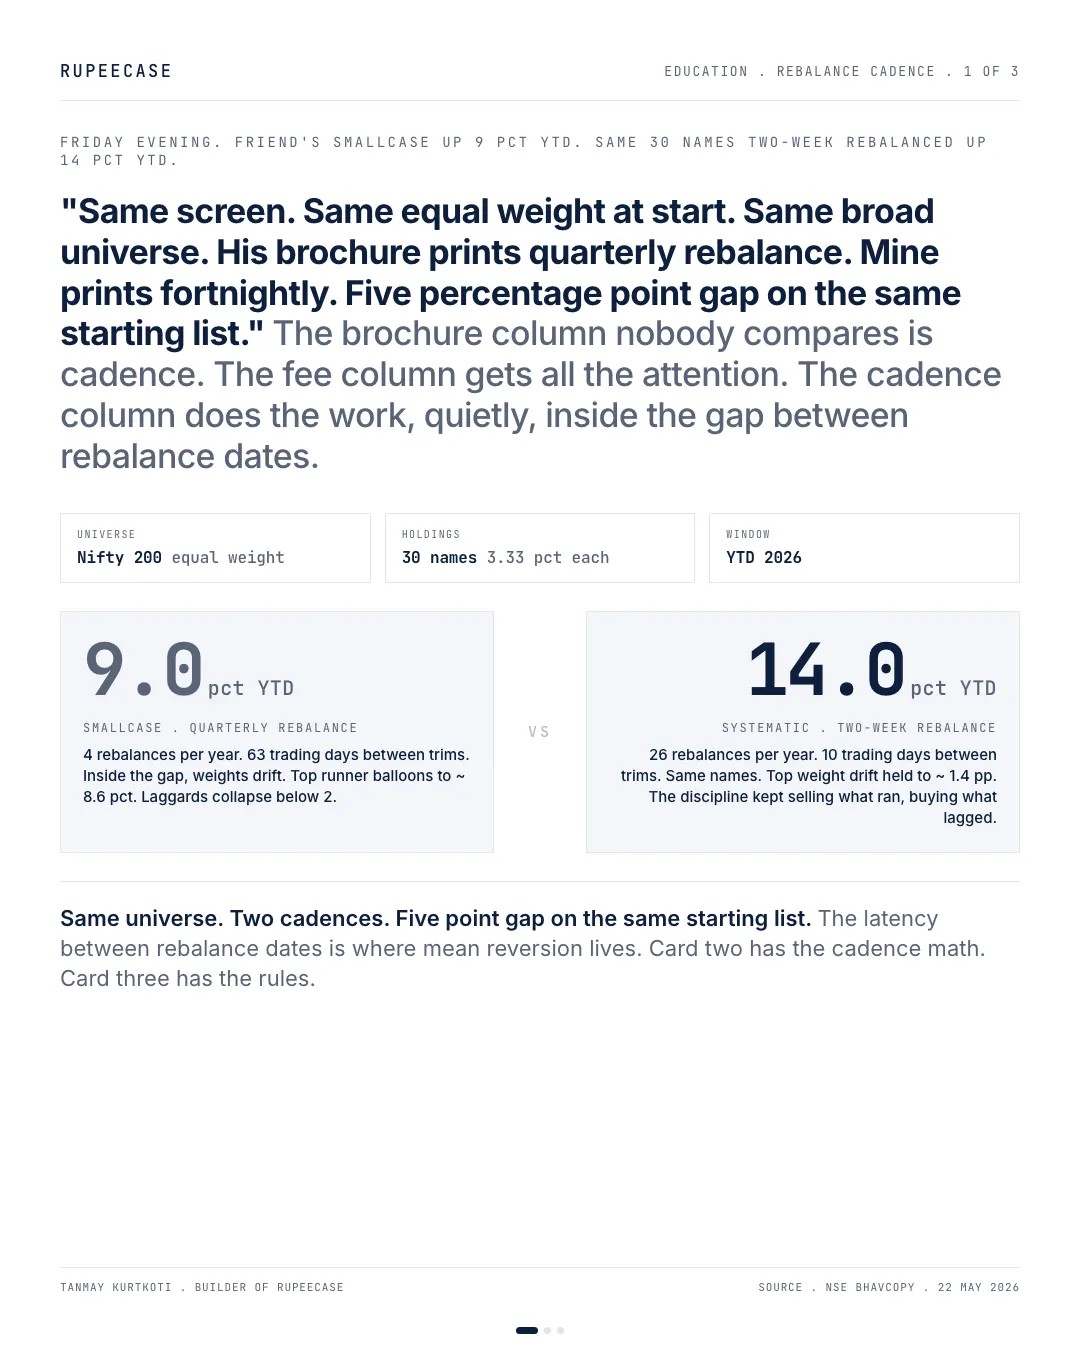
Friday evening. Friend forwards a screenshot of his model basket, the one with the friendly name and the slick onboarding. Up 9 pct YTD. He sounds happy.
Same 30 names sit inside a 2W rebalanced systematic strategy on my screen. Up 14 pct YTD. Same universe. Same equal weight at start. Same broad screen behind both. Five percentage point gap on the same starting list.
The brochure column nobody read is cadence.
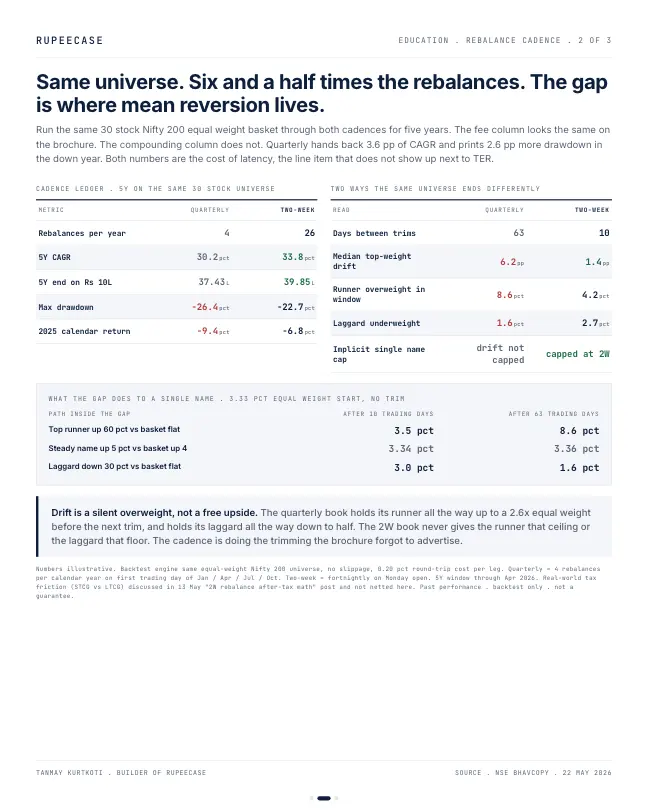
His basket rebalances four times a year. The systematic version rebalances twenty six times. Inside the quarter between his rebalances, the top weight balloons from 3.3 pct equal start to 8.6 pct on a runner. The laggards collapse below 2. By the time his next rebalance window arrives, the portfolio looks nothing like the screen it started as. Median top-weight drift inside a quarter on a thirty stock equal-weight basket sits at 6.2 percentage points. Inside two weeks it is 1.4.
The gap is where mean reversion lives. Run the same Nifty 200 equal-weight thirty-stock universe through both cadences over five years and the math lands at 30.2 pct CAGR quarterly versus 33.8 pct two-week, a 3.6 percentage point handover. The 2025 down year goes minus 9.4 pct on the quarterly book versus minus 6.8 pct on the 2W. The discipline that sells the runner before it bloats and refills the laggard before it bottoms is also the discipline that shallowed the hole when the regime turned.
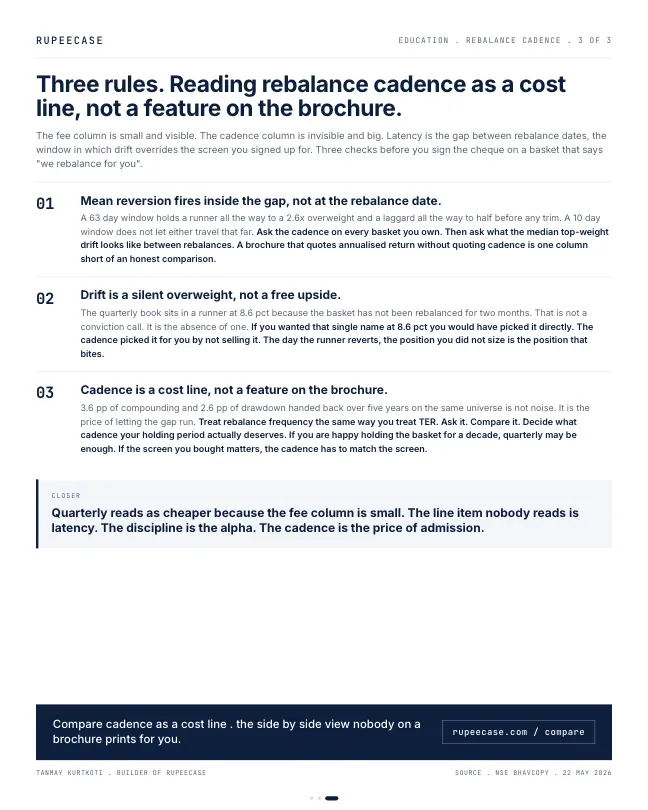
Quarterly reads as cheaper because the fee column is small. The line item nobody reads is latency. Drift is a silent overweight, not a free upside. The cadence is not a feature on the brochure. It is the cost line on the back of the page.
The discipline is the alpha
How one runner takes over an equal weight basket
Start with the arithmetic, because it is the whole story. Put Rs 10,00,000 into 30 stocks, equal weight. Each name gets Rs 33,333, which is 3.33 percent of the book.
Now let one stock run. Say it rises 40 percent in a quarter while the whole basket rises 4 percent. That stock is now worth Rs 46,667 inside a book worth Rs 10,40,000. Its weight is 46,667 divided by 10,40,000, which is 4.49 percent. Nobody decided to give it 35 percent more weight than its neighbours. Prices did.
Shrink the window to two weeks and the same runner might be up 6 percent against a basket up 0.6 percent. Its weight is 3.33 times 1.06 divided by 1.006, about 3.51 percent. The drift is a rounding error, and the next rebalance trims it before it compounds into a bet.
Change the inputs below and watch the weight move. These are illustrative figures for one stock, not a back test.
The opening of this note carries an honest tag: the quarterly against fortnightly figures are an illustration on sample figures, not a published back test. The mechanism does not need a back test to be true. A longer window lets winners and losers pull further from the target, and the free Learn module on rebalancing strategies walks through calendar, band and signal driven rules with the same rupee arithmetic.
What each cadence actually costs
Here is the part people use to defend quarterly: more rebalances mean more trades, and trades cost money. True. So price it instead of guessing.
Two lines matter on every rebalance. STT on delivery equity is 0.1 percent on the buy side and 0.1 percent on the sell side, unchanged in the Finance (No. 2) Act 2024 rates. The RupeeCase fee is 0.2 percent of the value traded at each rebalance, nothing in between. Together that is about 0.3 percent of every rupee that changes hands.
Now assume, for illustration, that a fortnightly book trades 8 percent of its value each time and a quarterly book trades 25 percent, because the quarterly book has more drift to undo. Over a year:
Fortnightly: 26 rebalances x 8% traded
Illustrative turnover
Quarterly: 4 rebalances x 25% traded
Illustrative turnover
Fortnightly cost a year on Rs 10 lakh
0.3% of traded value: STT 0.1% plus fee 0.2%
Quarterly cost a year on Rs 10 lakh
Same rates, illustrative turnover
So the faster cadence costs about Rs 3,240 more a year on Rs 10 lakh, or 0.32 percent. That is the real price of lower latency, and it is small next to a drift gap measured in whole percentage points. It is not zero, and it rises fast if turnover per rebalance is high. Plug your own turnover into the rebalance cost calculator before you believe anyone's cadence claim, mine included.
One more line sits off the fee table: tax. Every sale in a taxable account can book a gain. Listed equity held 12 months or less is taxed at 20 percent on the gain, for transfers from 23 July 2024. A fortnightly book sells more often, so more of its gains are short term. That is a real cost and it belongs in the same comparison.
The rebalance loop, step by step
Cadence is easier to judge once you see what happens inside one cycle. Every calendar rule runs the same four steps, only the gap between them changes.
- TargetEvery name starts at its rule weight, 3.33% in a 30 stock equal weight book.
- DriftPrices move. Runners gain weight, laggards lose it, the book becomes a bet nobody chose.
- MeasureOn the rebalance date, compare each weight to its target and list the trades.
- RestoreTrim the runners, top up the laggards, pay the cost, and the clock restarts.
Step two is the latency. A quarterly book spends about 13 weeks in it, a fortnightly book two. Longer drift is not free upside. It is a concentration you did not size, and it shows up worst on the day the runner reverses.
What it looks like on the screen
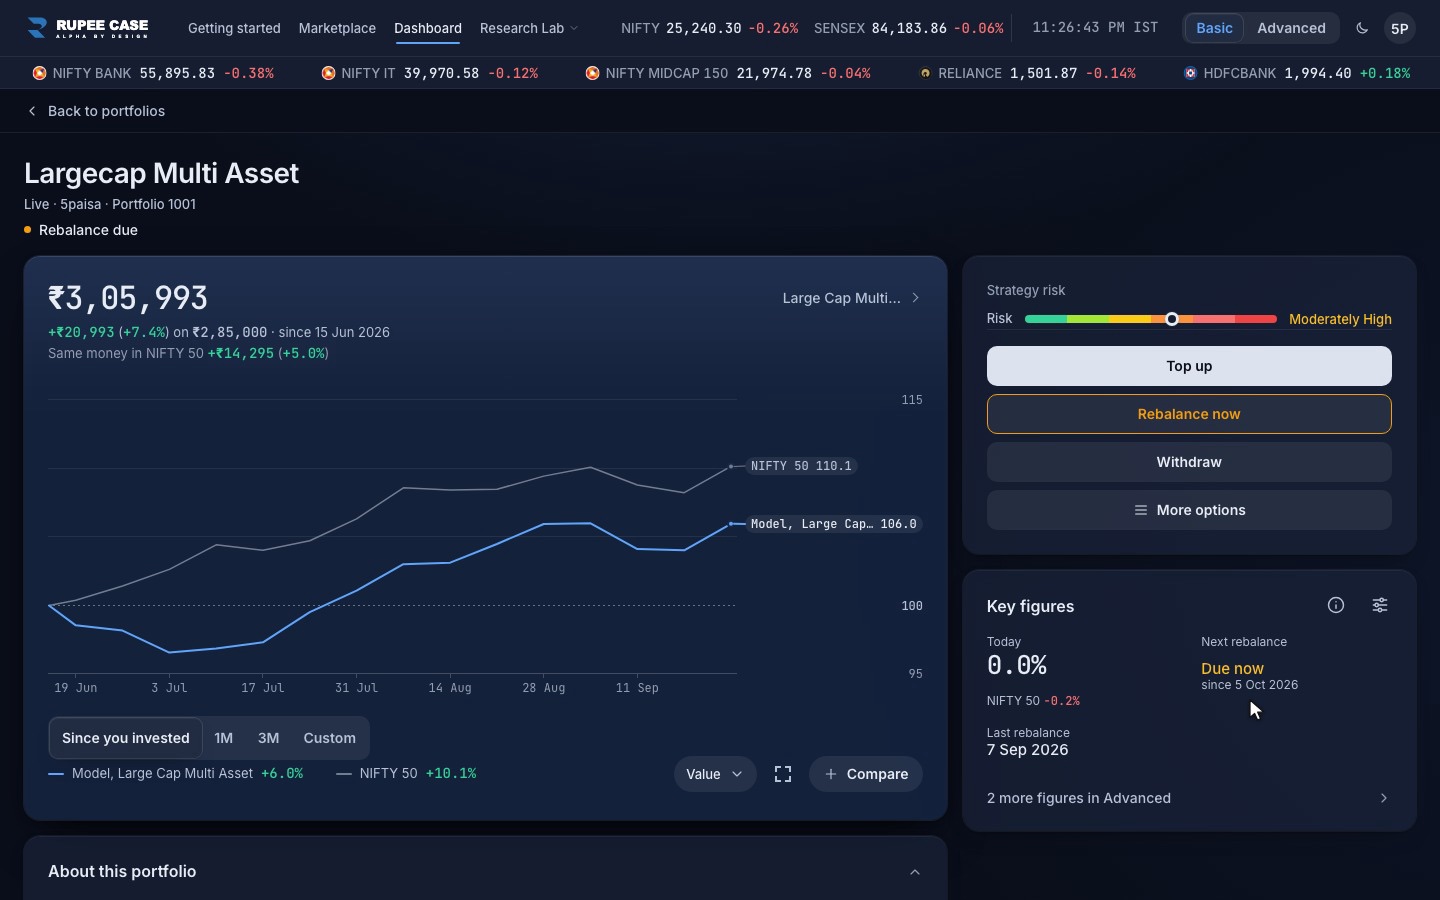
In the RupeeCase terminal the cadence is not a setting you remember. The portfolio page shows the last rebalance date, flags "Rebalance due" when the next one arrives, and puts the trade list behind one confirm step. The screen below uses sample data.
If you want the other side of this argument, what rebalancing actually pays looks at the return it adds, and allocation drift shows the same mechanism on a simple equity and debt mix.
Questions readers ask
How often should an equal weight portfolio be rebalanced?
There is no single right answer, only a trade off. A longer gap lets winners drift further above their target weight; a shorter gap trades more and pays more STT, fees and short term tax. Price both sides with your own turnover before you pick a calendar.
Does rebalancing more often always give higher returns?
No. Faster rebalancing keeps the portfolio closer to its rule, which can help when prices mean revert, but every extra trade has a cost. At about 0.3 percent of traded value, a book that turns over 200 percent a year pays about 0.6 percent a year before tax.
What is portfolio drift in a stock basket?
Drift is the gap between a stock's current weight and its target weight, created only by price moves. In a 30 stock equal weight book, one stock rising 40 percent while the basket rises 4 percent moves from 3.33 to about 4.49 percent of the portfolio.
The cards
3 cards. Swipe, or tap to open.
Explore next
Learn it properly, then see it applied.
- Free module 4.1Modern Portfolio Theory, What Actually Matters11 min read
- StrategyAllcap strategyNifty Total Market, 50 stocks, every 2 weeks
- Free module 4.3Rebalancing Strategies9 min read
- CalculatorRebalance cost at 0.2%Free, with the formula and a worked example
- Blog topicPortfolio construction notes33 notes
Related
- Rebalancing harvests volatilityAn equal weight five fund SIP drifted to 38/17/16/15/14 in two years, and a two asset napkin shows how rebalancing at the swing turns a flat round trip into a 10 percent gain.Portfolio construction . . 6 min
- Allocation drift: the risk you didn't chooseAn untouched 60/40 drifts to about 71/29 in ten years at 12 and 6.5 percent, and falls 27.8 instead of 23.2 percent when equity drops 40.Portfolio construction . . 6 min
- Rebalancing is not free. And it is not always money.Two 10 percent sleeves at 25 percent volatility earn a 1.88 point bonus at minus 0.20 correlation and 0.16 at plus 0.90, while a trending decade charges 1.39 points a year.Portfolio construction . . 11 min
Educational content only. Figures are illustrative and computed on historical or representative data for teaching purposes, not investment advice. Past performance does not guarantee future returns. Sourced from NSE, BSE, SEBI, AMFI and RBI public data.