

Factors..4 min read
Size matters, if you control your junk
Small beats large among quality stocks and among junk stocks, yet the blended small cap average trails because most small caps are junk.
By Tanmay Kurtkoti, founder of QC Alpha and builder of RupeeCase
A friend runs a small-cap SIP and asked me last week whether the small-cap premium is real or just a story funds tell to sell the product.
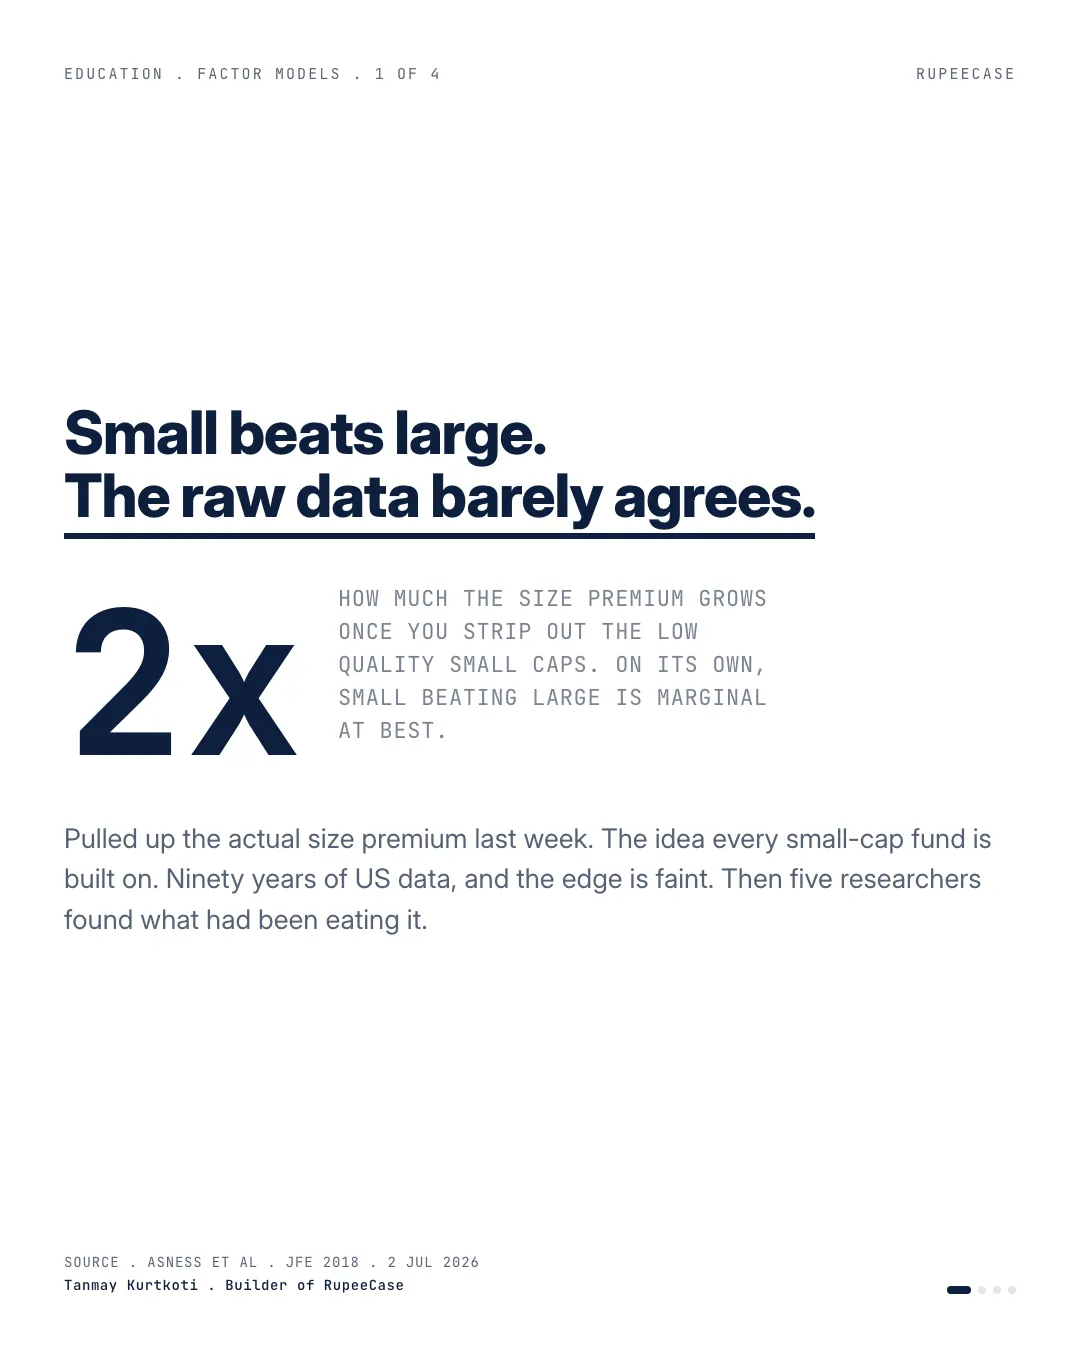
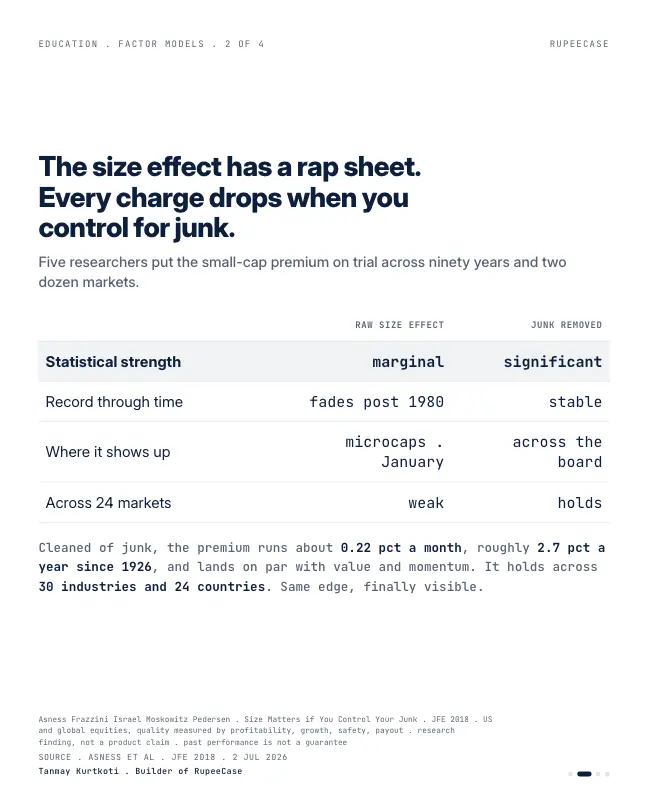
Fair question. So I pulled the data. Ninety years of US stock returns. And here is the uncomfortable part. On its own, small beating large is marginal at best. Weak record, faded after everyone discovered it in the 1980s, mostly showed up in January and in microcaps you can barely trade.
Then I reread the Asness paper that reframed the whole debate. Size Matters, If You Control Your Junk.
Their finding is the kind that reorganizes how you see the problem. Small-cap universes are stuffed with low-quality companies. Unprofitable, indebted, fragile. Large-cap universes lean the other way, toward the profitable and stable. So the size effect was quietly fighting a quality headwind the entire time.
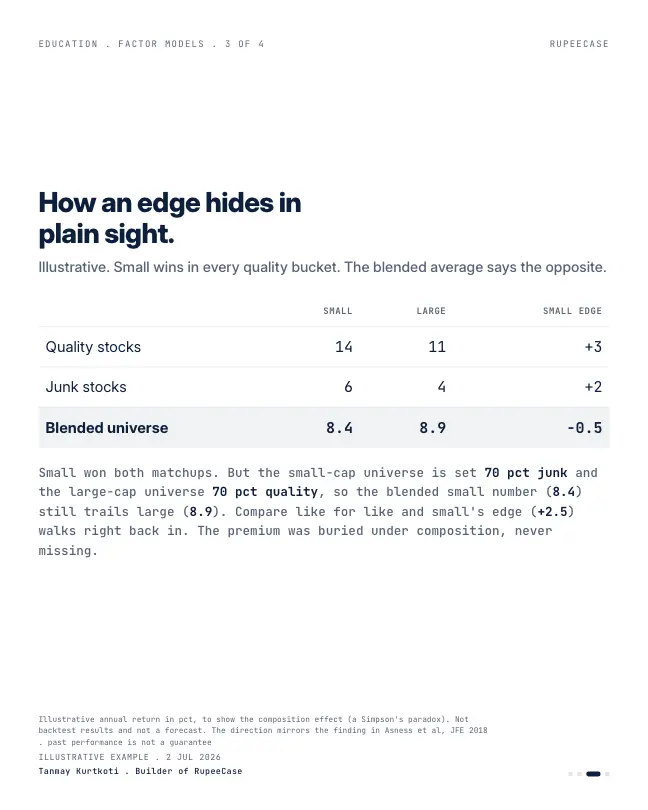
Here is the part that stops you. Among quality stocks, small beats large. Among junk stocks, small beats large. Small wins in both. But because most small caps are junk, the blended small-cap average still trails large. Small won every matchup and lost the scoreboard. A textbook composition trap.
Strip the junk out and the premium roughly doubles. It steadies across decades, shows up in 30 industries and 24 international markets, and stands on par with value and momentum.
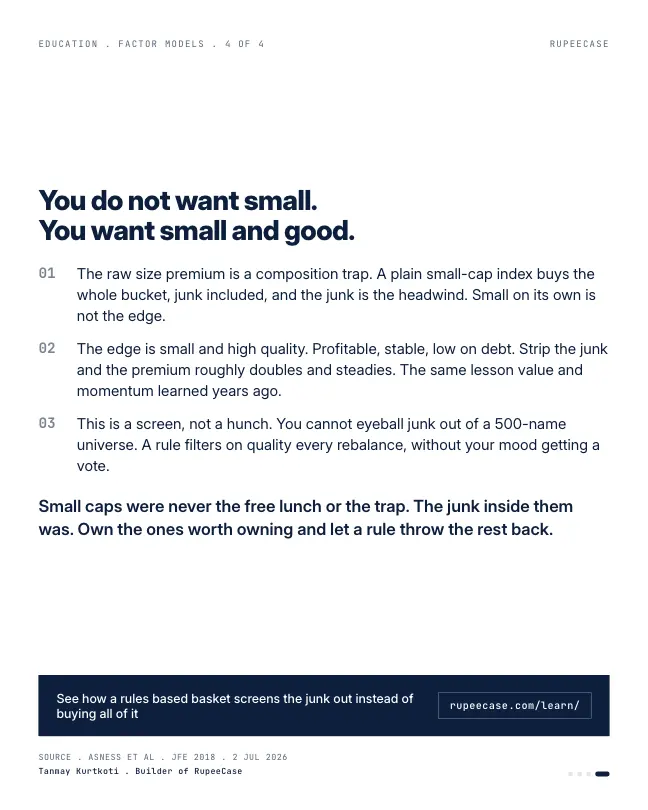
So the honest version is not small caps are great, or small caps are a trap. It is that you want small AND good. And you cannot eyeball junk out of a 500-name universe by hand. A rule that screens on quality does it every rebalance, without your mood getting a vote.
Small caps were never the free lunch. They were never the trap either. The junk inside them was.
How small can win every matchup and still lose
The composition trap sounds like a riddle until you put numbers on it. Here is a worked example with made up returns, chosen only to show the mechanics.
Split every company into four boxes: small or large, quality or junk. Say small quality stocks earn 16 percent a year and large quality stocks 13. Small junk earns 6 and large junk 4. Small beats large by 3 points among quality and by 2 points among junk.
Now the mix. Say 70 percent of the small cap universe is junk and only 30 percent of the large cap universe is. The small cap average is 0.3 x 16 + 0.7 x 6 = 9.0 percent. The large cap average is 0.7 x 13 + 0.3 x 4 = 10.3 percent. Small lost the scoreboard by 1.3 points while winning both matchups.
Change one input and watch the scoreboard flip. Cut the junk share of small caps from 70 to 40 percent and the small cap average rises to 12.0 percent, ahead of large. Nothing about small companies changed. Only the mix did.
What junk costs you on the way down
Junk does not only drag the average. It deepens the falls, because fragile companies get hit hardest when money gets tight. NSE's size indices over the two years to 9 Oct 2026 show the pattern in the depth of each fall.
Nifty 50, deepest fall in the two years
NSE index closes, to 9 Oct 2026
Nifty Midcap 150
NSE index closes, to 9 Oct 2026
Nifty Smallcap 250
NSE index closes, to 9 Oct 2026
Nifty Microcap 250
NSE index closes, to 9 Oct 2026
Each step down the size ladder added several points of depth. These are whole universe indices, junk included. A quality screen will not stop a small cap basket falling in a sell off, but it removes the names most likely to fall furthest and recover least.
What a quality screen looks for
You cannot read 250 balance sheets every fortnight. A rule can. The quality checks are plain accounting, the same ones a careful analyst would run by hand:
- ProfitablePositive earnings and a healthy return on equity, not a story about future profits.
- Not overborrowedDebt that the business can service from its own operating profit.
- SteadyEarnings that do not swing wildly from year to year.
- Then sizeOnly after the screen, lean toward the smaller names that passed.
The order matters. Screen first, then tilt toward small. Tilt toward small first and you have bought the whole bucket, junk and all. The free module on the size factor covers the liquidity limits and the junk problem in Indian small caps in more depth. I ran the size ladder on RupeeCase's own model strategies in the size myth on our own shelf, and the basics are in size factor decoded.
Questions readers ask
Is the small cap premium real?
On its own, the evidence is weak and unsteady. Research that controls for quality finds a clearer premium: small beats large among quality stocks and among junk stocks, but the plain small cap average is dragged down because small cap universes hold far more junk.
What is junk in stock market terms?
Junk means low quality companies: unprofitable, heavily indebted or with unstable earnings. They are more common among small caps. They tend to fall harder in sell offs; the Nifty Microcap 250 fell 28.5 percent at worst in the two years to 9 Oct 2026, against 15.6 percent for the Nifty 50.
How can small caps beat large caps in every group and still lose on average?
It is a composition effect. If small caps are 70 percent junk and large caps only 30 percent, the small cap average leans on its weakest group. With returns of 16 and 6 percent for small quality and junk, and 13 and 4 for large, the averages come out at 9.0 and 10.3 percent.
The cards
4 cards. Swipe, or tap to open.
Explore next
Learn it properly, then see it applied.
Reading path
Stop 4 of 8 on Factor primer
Related
- The size myth on our own shelfMidcap, Smallcap and Microcap printed 41.21, 41.03 and 40.56 percent while the Allcap basket did 48.02 with a similar worst drop, so small on its own is not an edge.Factors . . 5 min
- Size: a regime, not a ruleBanz's 5.2 percent size premium has decayed about 71 percent since publication, and on RupeeCase's own cap curve the return barely moves while the drawdown deepens.Factors . . 5 min
- Value and momentum: the two factors that disagreeA 50/50 blend of a 0.29 Sharpe value sleeve and a 0.50 momentum sleeve lands at 0.79, because their returns run at roughly minus 0.50 correlation.Factors . . 5 min
Educational content only. Figures are illustrative and computed on historical or representative data for teaching purposes, not investment advice. Past performance does not guarantee future returns. Sourced from NSE, BSE, SEBI, AMFI and RBI public data.