

Factors..5 min read
Factor timing is a rear view mirror
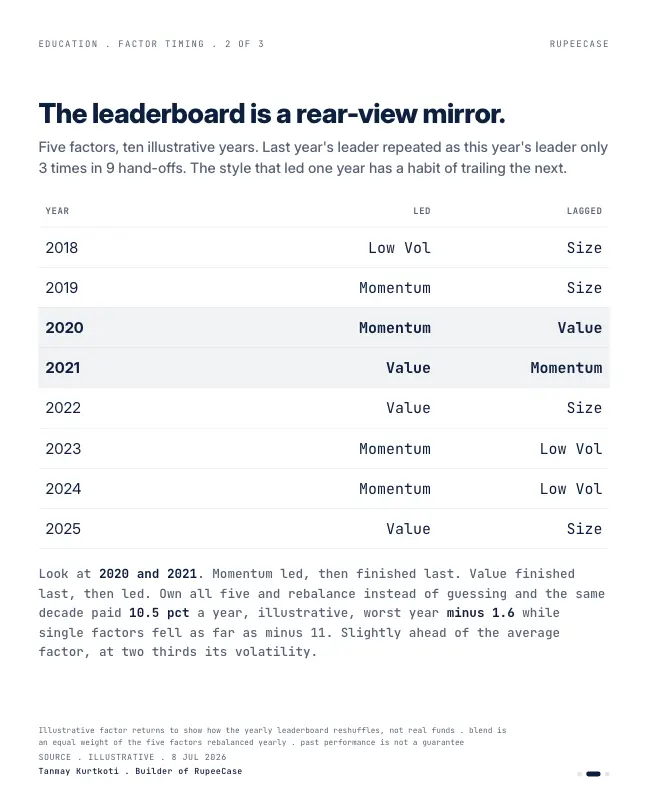
Across ten years the prior year's leading factor repeated only three times in nine hand offs, while an equal weight blend of five earned about 10.5 percent with a worst year of minus 1.6.
By Tanmay Kurtkoti, founder of QC Alpha and builder of RupeeCase
A friend forwarded a factor rotation pitch last night. Move into whichever style is working right now, it said. Value, momentum, quality, low volatility, whichever is hot. Then he asked me the obvious question. Which factor should I be in today.
So I pulled ten years of the factor leaderboard and put it in front of him.
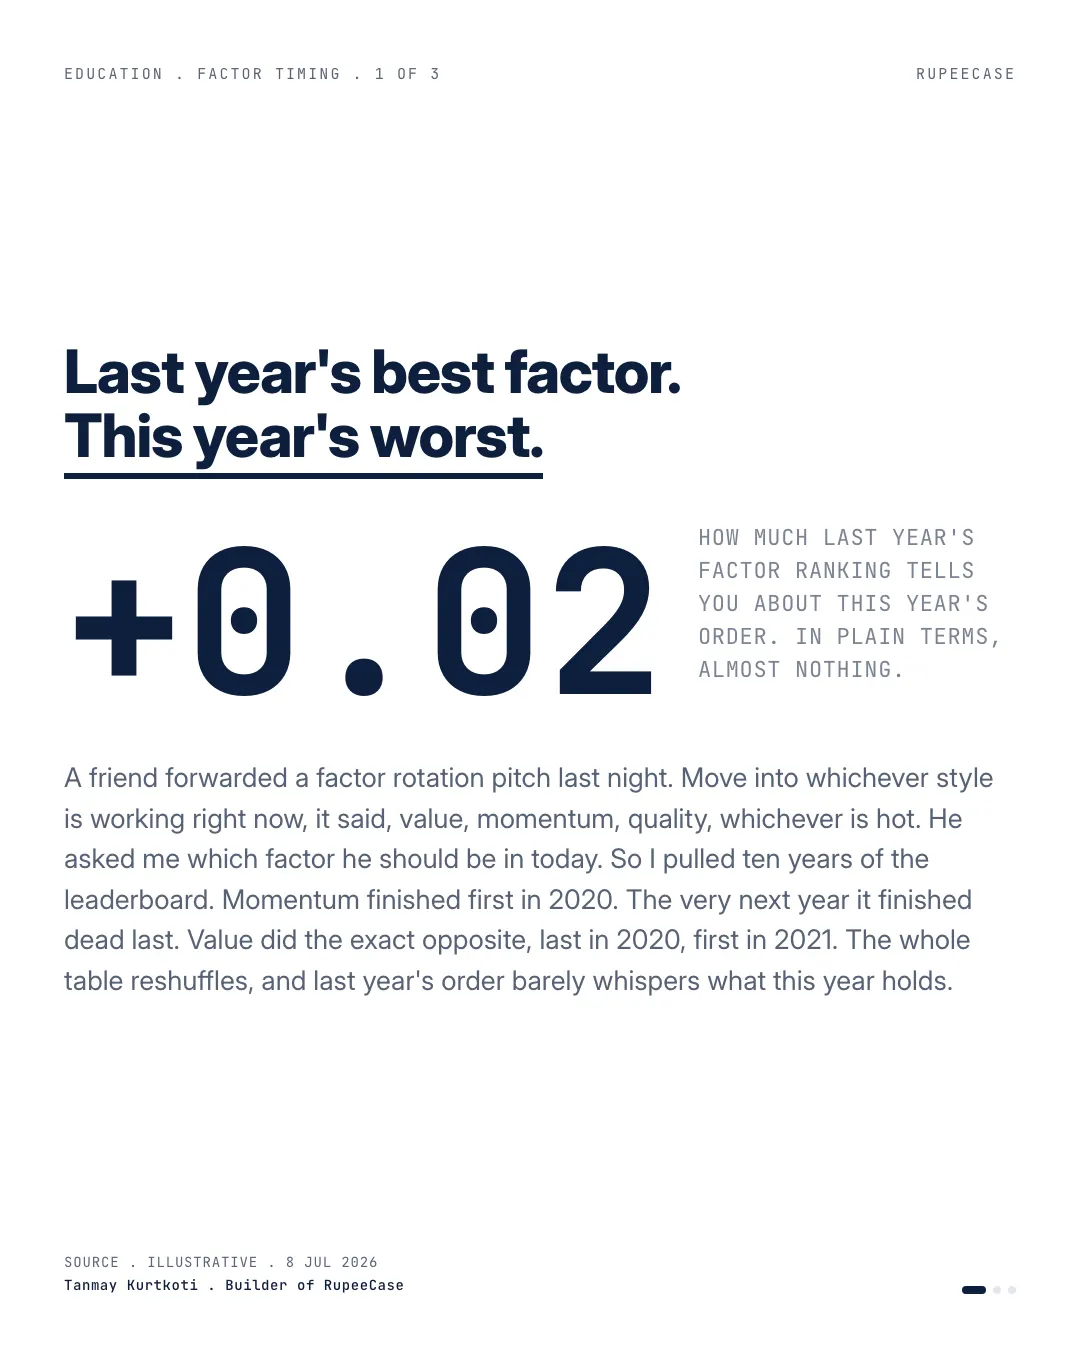
Momentum finished first in 2020. The very next year it finished dead last. Value did the exact opposite, last in 2020 and first in 2021. That reversal is not the exception. Across the decade, last year's leading factor repeated as this year's leader only three times in nine hand-offs. The correlation between where a factor ranked one year and where it ranked the next was basically zero. The leaderboard is a rear-view mirror. It tells you where you have been with perfect clarity and where you are going with none.
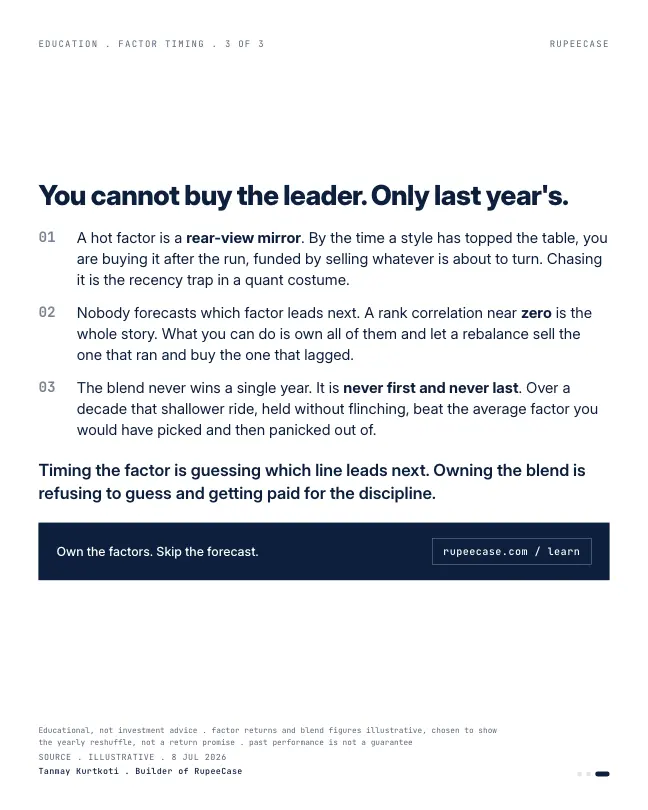
Which is why the rotation pitch quietly inverts itself. By the time a style has topped the table, you are buying it after the run, funded by selling whatever is about to turn. Chasing the hot factor is the recency trap wearing a quant costume.
Here is the part that actually pays. Own all five factors and let a rebalance do the work, selling the one that ran and buying the one that lagged. Over the same ten years that blend earned about 10.5 percent a year in my illustrative set, with a worst year of minus 1.6, while single factors fell as far as minus 11. It was never first. It was also never last. Slightly ahead of the average factor you might have picked, at two thirds of its volatility, and it needed no forecast at all.
Even Cliff Asness, who built a firm on factors, called factor timing deceptively difficult. Owning the blend is refusing to guess and getting paid for the discipline:
Three in nine is barely better than a coin
How good is three repeats in nine hand offs? Compare it with pure chance. With five factors, a leader picked at random repeats one year in five. Over nine hand offs that is 1.8 repeats expected from luck alone. Three is a little more than luck. It is not a signal anyone could trade on, and it leaves six years in nine where last year's winner was not this year's.
The same flip, on NSE indices in 2026
The leaderboard flips in India too, and you can see it inside a single year. Here are NSE's factor indices over three windows ending on 9 Oct 2026, price only.
| Index | 6 months | 1 year | 2 years |
|---|---|---|---|
| Nifty Alpha 50 | 13.5 | 9.5 | -7.5 |
| Nifty200 Value 30 | -8.4 | 2.4 | 0.9 |
| Nifty200 Momentum 30 | -2.2 | -5.9 | -21.5 |
| NIFTY200 Quality 30 | -3.7 | -9.3 | -17.5 |
| Nifty100 Low Vol 30 | -3.8 | -8.3 | -10.1 |
| Nifty 500 | -0.8 | -5.9 | -7.3 |
Price change to 9 Oct 2026 from NSE index closes. Before dividends. A past episode, not a forecast.
Read down the columns. Over two years value was the only factor index in positive territory. Over the last six months it was the worst of the six. The Nifty Alpha 50, a momentum style index, was deep in the red over two years and the clear leader over six months. A rotation rule that read the two year column in April would have walked into the six month one.
A worked example: switch or rebalance in April 2026
Here is that April, in rupees. Take Rs 10,00,000 split half in the Nifty200 Value 30 and half in the Nifty200 Momentum 30. By 9 Apr 2026 value had risen about 11.8 percent over the previous six months and momentum had fallen about 3.8 percent, both worked out from the NSE figures in the table. Value was clearly the hot factor.
The rotation pitch says move everything into value. The rebalance rule says put the two back to half each. Six months later, on 9 Oct 2026:
- All in valueRs 9,16,000
- Rebalanced 50/50Rs 9,47,000
- All in momentumRs 9,78,000
Rs 10,00,000 on 9 Apr 2026, value on 9 Oct 2026. Six month price changes of minus 8.4 percent (Nifty200 Value 30) and minus 2.2 percent (Nifty200 Momentum 30), NSE index closes. Before costs and tax. RupeeCase calculation.
The rebalanced pair lost 5.3 percent. Switching to the leader lost 8.4. The best result came from the factor that had been losing, which no rotation rule would have picked in April. The blend never needs to know which one that will be.
- A factor tops the tableIts run is already in the price and on every screen.
- The pitch says rotateSell the laggard, buy the leader, after the move.
- Leadership turnsYear to year ranks are close to random, so the turn comes without warning.
- A rebalance does the reverseTrims the leader and adds to the laggard, on a date, with no forecast.
The free module on factor timing and cycles walks through why timing signals look strong on paper and weak in practice, with a quarterly rebalance example on NSE indices. The same habit is behind factor chasing, and why a blend of two factors that disagree is easier to hold is in the value and momentum post.
Questions readers ask
Can you time factor investing?
The evidence says it is very hard. Year to year factor rankings are close to random, so last year's leader repeats only slightly more often than chance. On NSE data, the Nifty200 Value 30 led over the two years to 9 Oct 2026 and was the weakest factor index over the last six months of that window.
What is factor rotation?
Factor rotation means moving money into whichever style, such as value, momentum or quality, has done best recently. It buys after the run and sells the style that has lagged, which is often the one about to recover. A fixed rebalance between factors does the opposite on a schedule.
Is rebalancing between factors better than picking one?
It is rarely the best result in any single period, and rarely the worst. In the April 2026 example a 50/50 rebalance of NSE's value and momentum indices lost 5.3 percent over six months, against 8.4 percent for switching into value and 2.2 percent for holding only momentum.
The cards
3 cards. Swipe, or tap to open.
Explore next
Learn it properly, then see it applied.
Reading path
Stop 8 of 8 on Factor primer
Related
- Last year's best factor is a bad forecastBuying the prior year's leading factor compounded to about 58 percent over five years while an equal weight blend of all five made 72, because the leader repeated once in five tries.Factors . . 5 min
- Value and momentum: the two factors that disagreeA 50/50 blend of a 0.29 Sharpe value sleeve and a 0.50 momentum sleeve lands at 0.79, because their returns run at roughly minus 0.50 correlation.Factors . . 5 min
- The asset growth factorCompanies that grew assets slowest beat the fastest expanders by around 13 percent a year over 1968 to 2003, a finding Fama and French wrote into their five factor model.Factors . . 5 min
Educational content only. Figures are illustrative and computed on historical or representative data for teaching purposes, not investment advice. Past performance does not guarantee future returns. Sourced from NSE, BSE, SEBI, AMFI and RBI public data.