

Factors..5 min read
The factor zoo
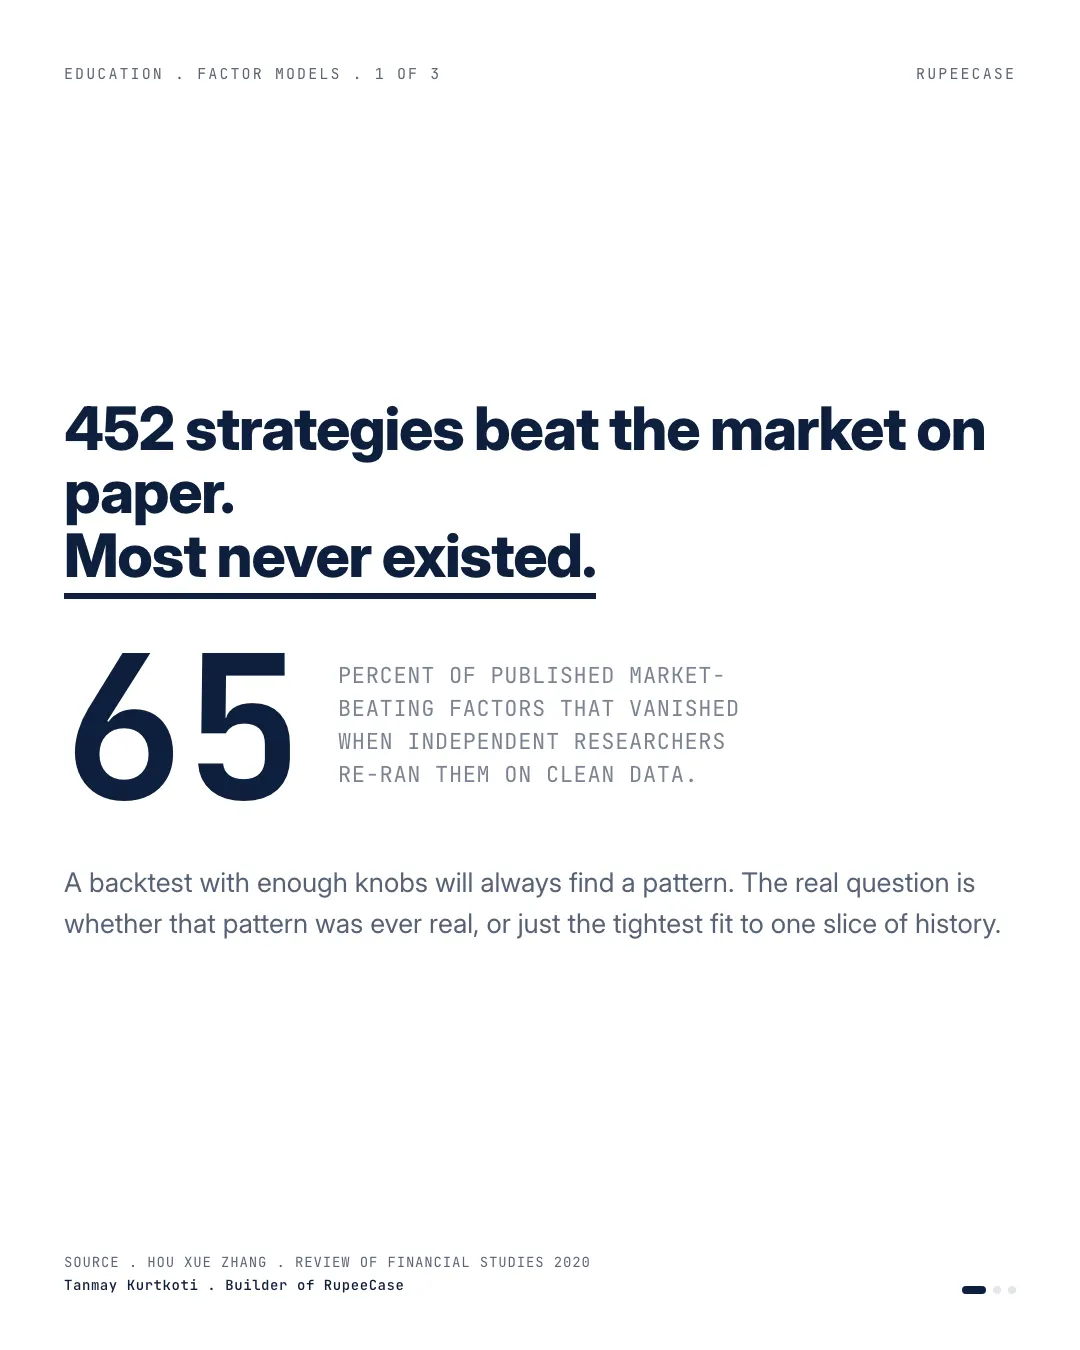
Hou, Xue and Zhang rebuilt 452 published factors and found 65 percent failed a basic test and 82 percent failed an honest one.
By Tanmay Kurtkoti, founder of QC Alpha and builder of RupeeCase
A friend forwarded me a model stock basket last week. Six-factor edge, the pitch said. Beats momentum. Look at the backtest.
The chart was beautiful. Smooth line, up and to the right, crushing the index. And that is exactly when I get nervous.
Because a backtest is not a result. It is a hypothesis dressed up as one.
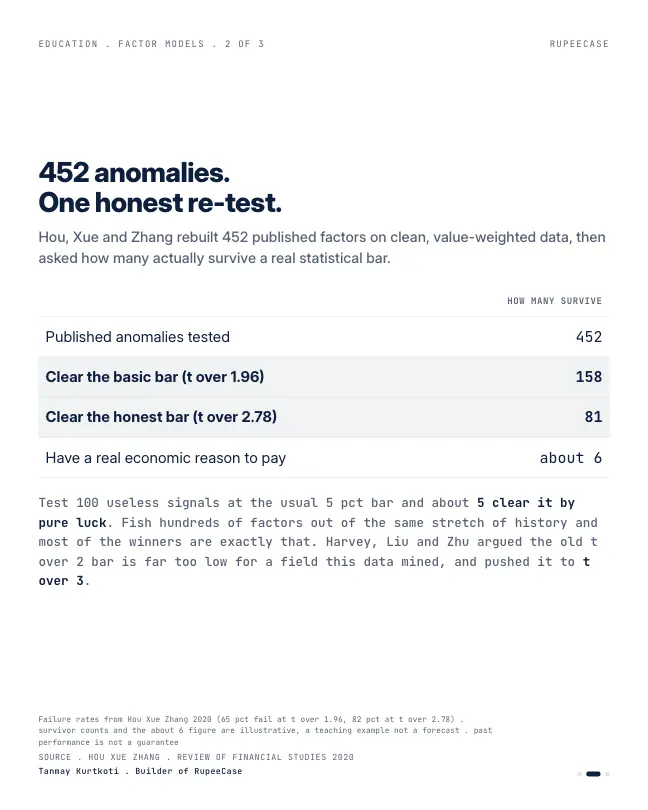
Years ago, three researchers (Hou, Xue and Zhang) took 452 published "market-beating" factors and did the boring thing nobody does. They rebuilt every one on clean data and asked how many actually survived a real statistical test. Sixty-five percent could not clear even a basic bar. Raise it to an honest bar, the kind you should use when hundreds of people are mining the same history, and eighty-two percent were gone.
Most of the famous factors were never there.
Here is why this happens, and it is not fraud. Test 100 useless signals against the past and about five will look "significant" by pure chance. Now picture an entire industry fishing in the same dataset. Someone always lands a winner. It just doesn't predict the next year, because it never described anything real in the first one.
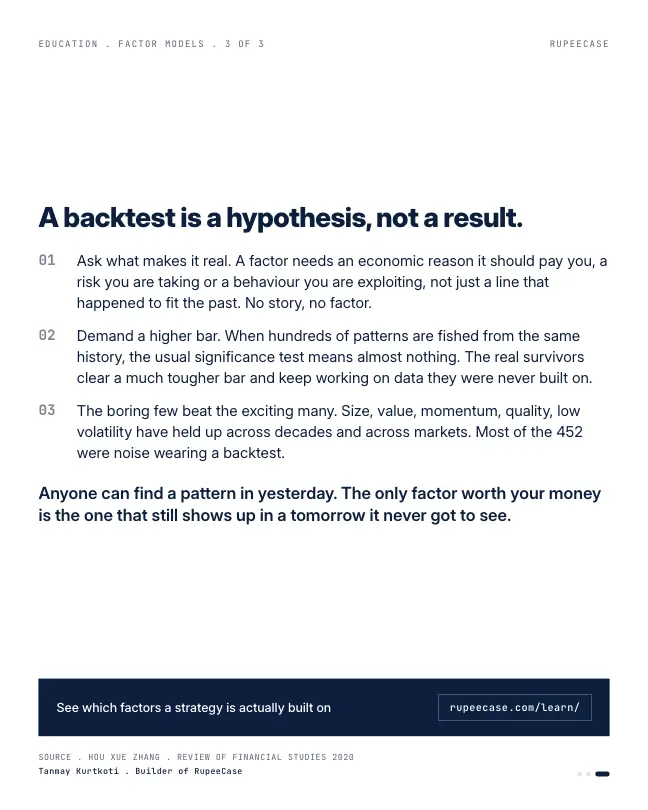
The few that hold up (size, value, momentum, quality, low volatility) share two things the zoo doesn't. There is an economic reason they should pay you, a risk you carry or a behaviour you exploit. And they keep working on data they were never built on.
So the next time a backtest takes your breath away, don't ask how good the line looks. Ask what makes the factor real, and whether it survives a bar high enough to kill a coincidence.
Anyone can find a pattern in yesterday. The only factor worth your money is the one that still shows up in a tomorrow it never got to see.
Why five in a hundred is guaranteed
The "about five" in the opening comes straight from how a significance test is set up. The usual bar asks whether a result would happen by luck less than 5 percent of the time. So if a signal has no real edge, it still has a 5 percent chance of passing. Test 100 such signals and you expect 5 to pass. Not because anyone cheated. Because that is what the 5 percent means.
The chance that at least one of them passes is much higher than 5 percent. With 20 useless signals it is 1 minus 0.95 to the power 20, about 64 percent. With 100, it is over 99 percent. If you test enough ideas, a beautiful backtest is close to certain.
Now lower the pass rate to 1 percent, a harder bar. With 100 signals you expect one false winner and the chance of at least one falls to about 63 percent. A higher bar is the only defence when many people test many ideas on the same history. That is what the "honest bar" in the opening means.
NSE's factor indices show the same gap
India has its own small version of this test. NSE launched each of its factor indices on a date, and published history before that date as a back calculation: the rule applied to past data. The back calculated years are a model. The years after launch are live.
- Momentum 30, since 200518.30%
- Momentum 30, last 5 years9.28%
- Quality 30, since 200516.64%
- Quality 30, last 5 years6.40%
- Nifty 200, last 5 years8.30%
Total return CAGR. Nifty200 Momentum 30 launched 25 Aug 2020, NIFTY200 Quality 30 launched 17 Apr 2018; earlier years are NSE's back calculation. NSE Indices factsheets, 30 Sep 2026.
These are real factors with sound reasons behind them, not data mined ones. Even so, the live five years came in at about half of the long run figure. Part of that is a hard market: the Nifty 200 itself did 8.30 percent over the same five years. Part of it is that a rule chosen by people who could already see the past will look better on that past than on the years that follow.
The quality index trailed its parent over those five live years. The momentum index stayed only about one point ahead. A real factor survives out of sample. It rarely survives at the size of its back test.
Four questions before you trust a factor
The opening names the two tests that matter. Here they are as a checklist, with two more that follow from them.
- Is there a reason?A risk the holder carries or a behaviour the rule exploits. No story, no premium.
- Does it clear a high bar?How many versions were tried before this one? The more tries, the higher the bar must be.
- Does it work on new data?Years after the rule was fixed, and other markets it was not built on.
- Does it survive costs?Turnover, spreads and tax take a share of every premium before it reaches an account.
The last step is its own post: the turnover tax shows how much of a premium trading costs can take. And once a factor is famous, money crowds in; factor crowding and decay covers what that does to the edge. The free Learn module on introduction to factors covers the five classic factors and the economic reason behind each one.
MythA back test with a smooth, steep line proves the strategy works.
FactA back test shows the rule fits the past. Only years the rule never saw can show it works. NSE's momentum index earned about half its long run figure in its five live years.
Questions readers ask
What is the factor zoo?
It is the name for the hundreds of return predicting factors published in finance research. A replication of 452 of them found that 65 percent failed a basic statistical test and 82 percent failed a stricter one. A handful, such as value, momentum, quality, size and low volatility, have held up.
What does back calculated mean on an NSE index factsheet?
It means the index rules were applied to data from before the launch date to show how the index would have behaved. Those years are a model, not live history. The Nifty200 Momentum 30 launched on 25 Aug 2020, so its record since 2005 includes about fifteen back calculated years.
Why do back tests look better than live results?
A rule is usually chosen after many versions were tried on the same history, so the winner partly fits luck. Live years do not share that luck. NSE's momentum and quality indices earned 9.28 and 6.40 percent a year over five years, against 18.30 and 16.64 since 2005.
The cards
3 cards. Swipe, or tap to open.
Explore next
Learn it properly, then see it applied.
Related
- The turnover tax on a factorA 5.7 percent gross premium became 4.2 after trading costs, and factors traded slower than about half the book a month tend to keep a net edge.Factors . . 6 min
- Factor crowding and decayMcLean and Pontiff found the median published anomaly kept 42 percent of its in sample alpha, which is why a brochure backtest and a live fund can sit nine points apart.Factors . . 5 min
- The edge decays when you read about itMcLean and Pontiff measured 26 percent decay out of sample and 58 percent after publication, which stretches a 0.60 Sharpe's proof time from 11 years to 59.Factors . . 13 min
Educational content only. Figures are illustrative and computed on historical or representative data for teaching purposes, not investment advice. Past performance does not guarantee future returns. Sourced from NSE, BSE, SEBI, AMFI and RBI public data.