

Portfolio construction..4 min read
Volatility is half the story, correlation decides
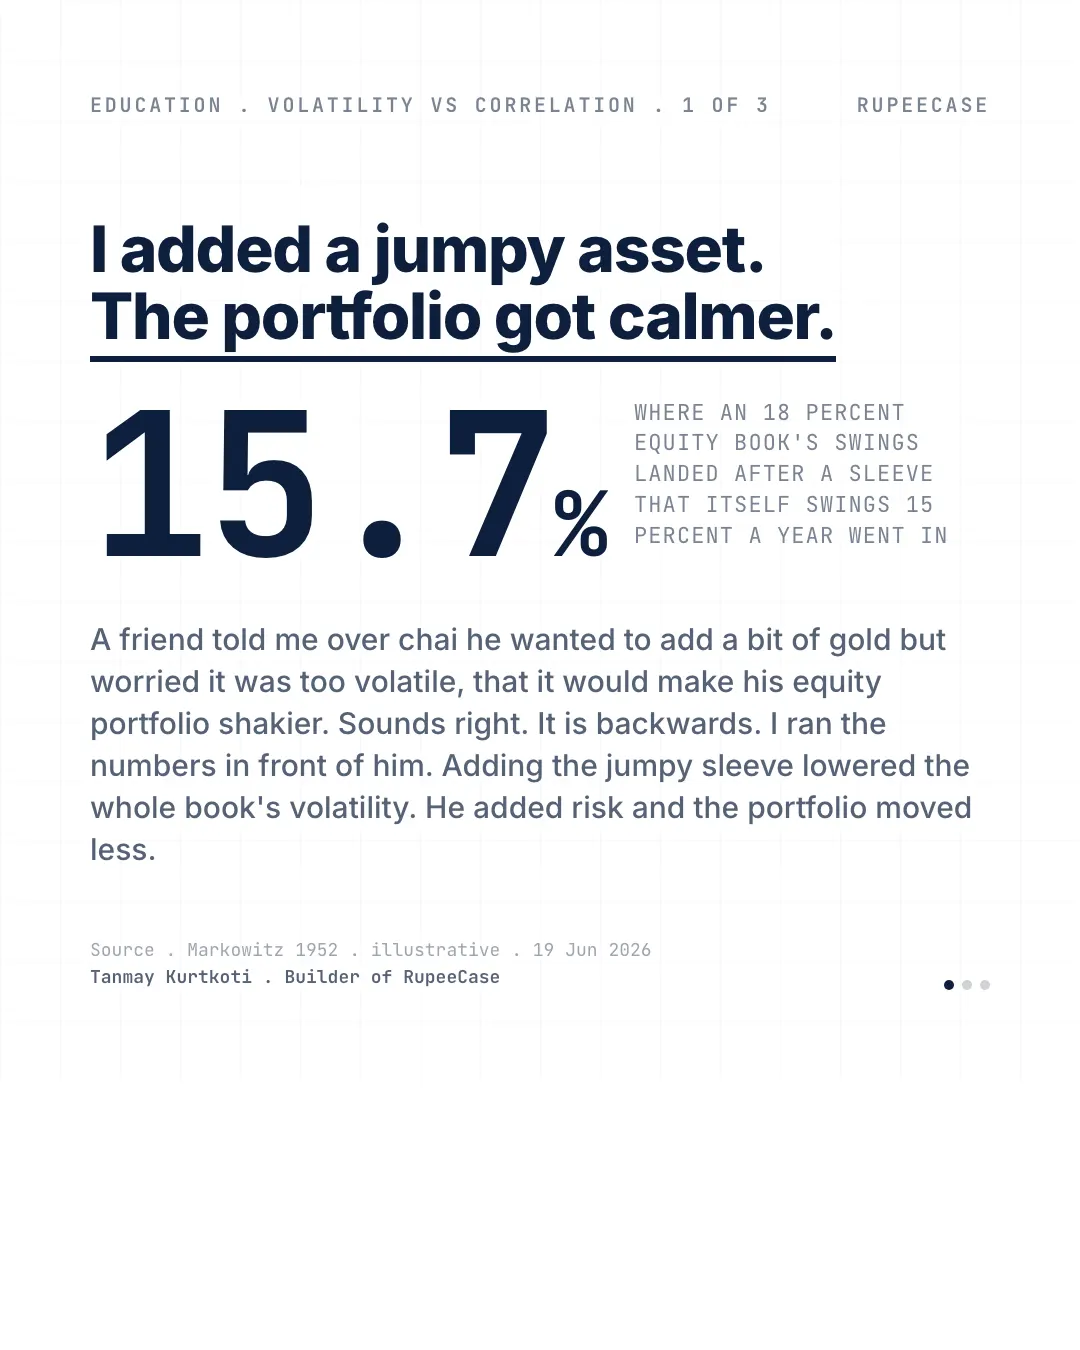
Adding 20 percent gold at 15 percent volatility to an 18 percent volatility equity book brings the blend down to 15.0, because gold rarely falls on equity's bad days.
By Tanmay Kurtkoti, founder of QC Alpha and builder of RupeeCase
A friend told me over chai he wanted to add a little gold to his portfolio, then talked himself out of it. Too volatile, he said. It will just make my equity book shakier.
It sounds completely reasonable. It is also backwards, and I had the numbers on my phone, so I showed him.
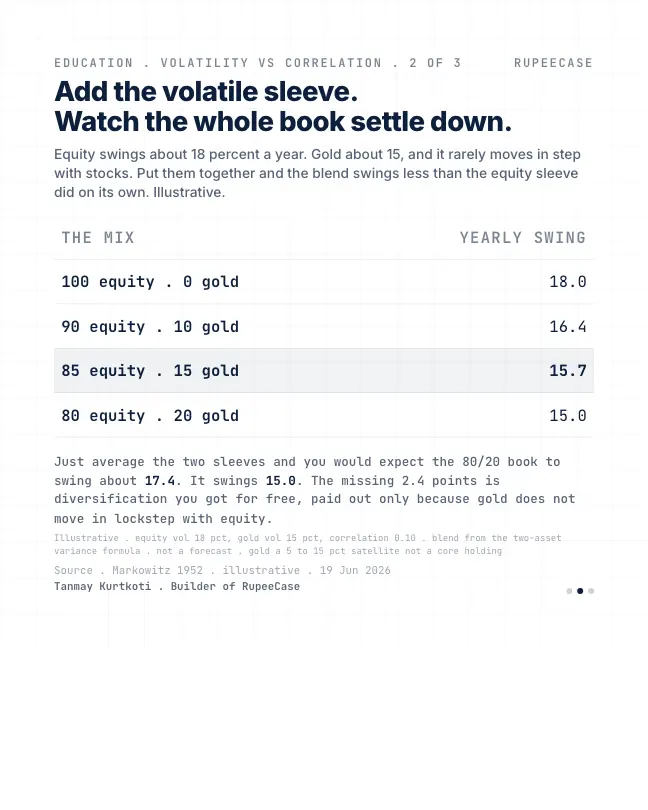
His equity portfolio swings about 18 percent in a typical year. Gold swings about 15, almost as much, and most people file it under "risky" for exactly that reason. But gold rarely moves in step with stocks. So I blended them. Put 15 percent gold into the book and the whole thing swings 15.7 percent, down from 18. Push it to 20 percent gold and it swings 15.0. He added a volatile asset and the portfolio got calmer.
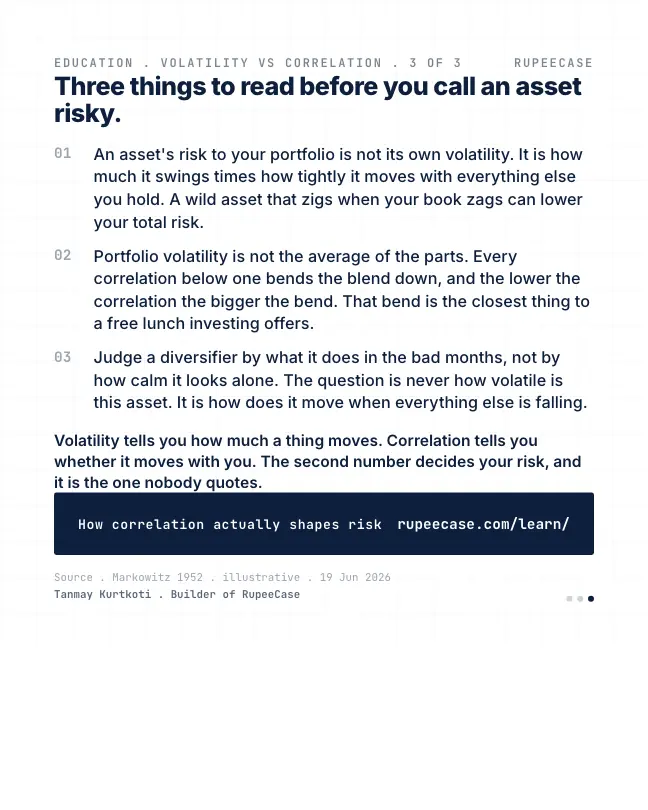
Here is the part nobody tells you. The risk an asset brings to your portfolio is not its own volatility. It is its volatility times how tightly it moves with everything else you already hold. Portfolio risk is not the average of the parts. If you just averaged those two sleeves you would expect the 80/20 book to swing about 17.4 percent. It swings 15.0. That missing 2.4 points is diversification you got for free, and you got it only because gold does not fall on the same days equity does.
The honest version: every correlation below one bends the blend down, and the lower the correlation the bigger the bend. That bend is the closest thing to a free lunch this business offers. It is also why a calm-looking asset that moves in lockstep with your stocks adds more hidden risk than a wild one that goes its own way.
So stop asking how volatile an asset is. Ask how it behaves in the months everything else is falling. That is the number that decides your risk, and it is the one no brochure ever quotes.
Volatility is half the story. Correlation is the half that decides:
- Correlation minus 0.214.1%
- Correlation 014.7%
- Correlation 0.115.0%
- Correlation 0.516.1%
- Correlation 117.4%
Volatility of 80% equity at 18% and 20% gold at 15%. Illustration inputs from the opening; the opening's 15.0 corresponds to a correlation of about 0.1.
At a correlation of 1 the blend is just the weighted average, 17.4 percent. Every step down in correlation pulls the swing lower, and below zero the gold sleeve actively cancels part of equity's moves.
The same test on a real Indian year
The opening uses round numbers. Here is one actual year on NSE data, 30 Sep 2025 to 30 Sep 2026, with the Nifty 50 for equity and an NSE listed gold ETF for gold. Gold was not the calmer asset that year: its monthly returns swung about 26.6 percent annualised against about 16.9 for the index. On the brochure logic, adding it should have made things worse.
| Month | Oct | Nov | Dec | Jan | Feb | Mar | Apr | May | Jun | Jul | Aug | Sep |
|---|---|---|---|---|---|---|---|---|---|---|---|---|
| Nifty 50 | 4.5 | 1.9 | -0.3 | -3.1 | -0.6 | -11.3 | 7.5 | -1.9 | 1.4 | 2.2 | -1.2 | -6.1 |
| Gold ETF | 4.4 | 4.6 | 5.2 | 19.1 | 0.4 | -7.9 | 1.8 | 4.2 | -9.9 | 1.0 | 8.7 | -4.5 |
Month end closes, Oct 2025 to Sep 2026, price change in percent. NSE bhavcopy: Nifty 50 index and an NSE listed gold ETF.
Now blend them. An 80/20 mix, reset each month, swung about 15.5 percent annualised. A weighted average of the two volatilities would have said 18.9. An 85/15 mix swung about 15.7 percent. Both blends were calmer than the index on its own, even though the sleeve added was far more volatile than the index. The correlation of the monthly returns was about 0.20.
Read the table for the bad months too. In March 2026, the worst month for the index at minus 11.3 percent, gold also fell, by 7.9 percent. In September, minus 6.1 against minus 4.5. Gold helped most in January, when the index fell 3.1 percent and gold rose 19.1. The free lunch was real over the year, and it was not served every month. That is the diversification cliff in miniature.
Measure the free part yourself
Set the correlation to 1 and the free part goes to zero. Set it to 0.8, about what two equity funds in the same category show, and most of it disappears. That is the case for a diversifier that is different, rather than one that is merely calm.
MythA volatile asset always makes a portfolio more volatile.
FactOver Sep 2025 to Sep 2026, gold swung 26.6 percent against 16.9 for the Nifty 50, yet an 80/20 blend swung only about 15.5.
The free Learn module on gold, commodities and international investing covers how Indian investors hold gold, its tax treatment after July 2024, and where it fits in a mix, with a quiz at the end. The Sharpe and volatility calculator checks any blend's risk.
Questions readers ask
Does adding gold reduce portfolio risk?
It can, when gold moves differently from equity. On NSE data for Sep 2025 to Sep 2026, an 80/20 mix of the Nifty 50 and a gold ETF swung about 15.5 percent a year against 16.9 percent for the index alone, even though gold itself was more volatile.
What is correlation in investing?
It measures how closely two assets move together, from minus 1 (always opposite) to plus 1 (always together). The lower the correlation between two holdings, the more each one cancels part of the other's swings.
Why is gold called a diversifier?
Because its returns have often had a low correlation with equity returns. That is not a promise for every month: in March 2026 the Nifty 50 fell 11.3 percent and a gold ETF fell 7.9 percent in the same month.
The cards
3 cards. Swipe, or tap to open.
Related
- Why adding gold can improve an all equity bookA 20 percent gold sleeve at 0.15 correlation takes a 13/19 equity book to 12.0 percent return and 15.9 percent volatility, because the variance cross term shrinks.Portfolio construction . . 4 min
- The diversification cliffIn March 2008 and March 2020 the textbook diversifiers fell together, because correlation is conditional and jumps from 0.10 to 0.55 for equity and gold in a liquidity crunch.Portfolio construction . . 5 min
- The calm day contractThe same investor scored Moderately Aggressive on a quiet day and Conservative three weeks into a wobble, so fill the profile on a boring day and treat it as a contract.Portfolio construction . . 5 min
Educational content only. Figures are illustrative and computed on historical or representative data for teaching purposes, not investment advice. Past performance does not guarantee future returns. Sourced from NSE, BSE, SEBI, AMFI and RBI public data.