

Portfolio construction..5 min read
The split decides more than the pick
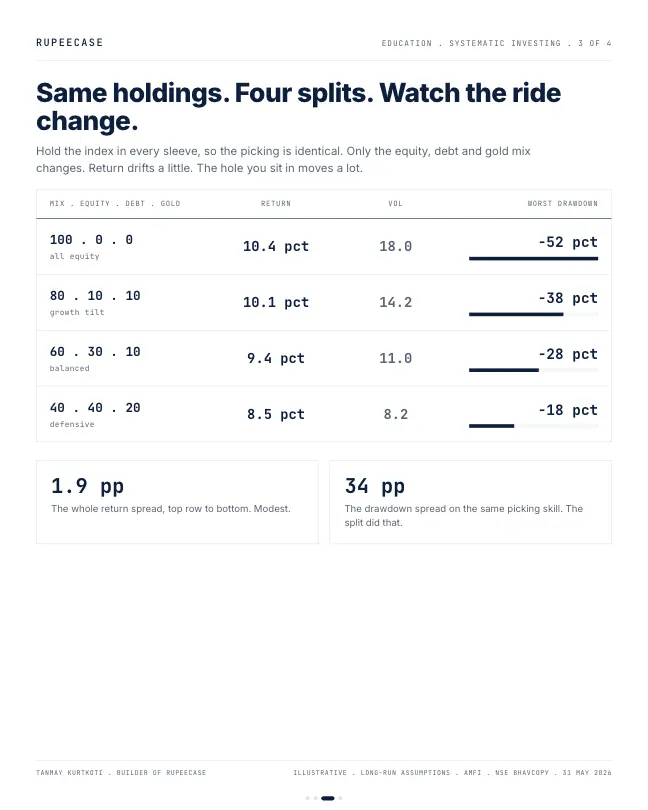
Brinson's finding is about variability, not return, and holding the same index at 100/0/0 versus 40/40/20 trades two points of return for 34 points of drawdown.
By Tanmay Kurtkoti, founder of QC Alpha and builder of RupeeCase
A friend spent his entire Sunday comparing two large-cap funds. Spreadsheet open, expense ratios lined up, five year charts side by side. He wanted to know which one to pick.
I told him he was sweating the small decision and skipping the big one.
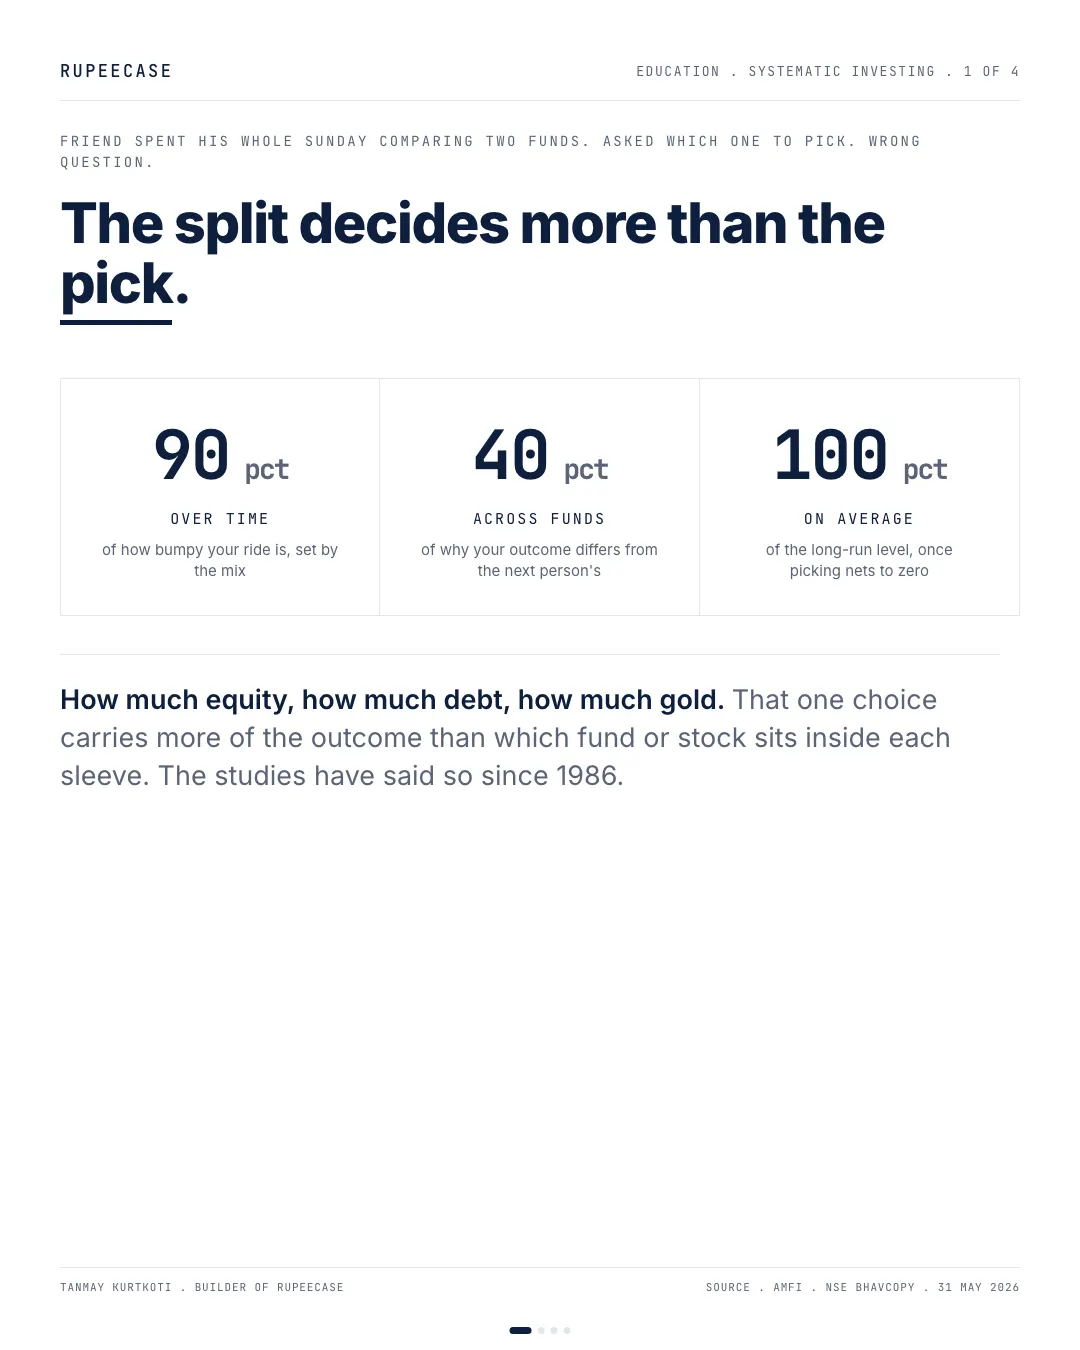
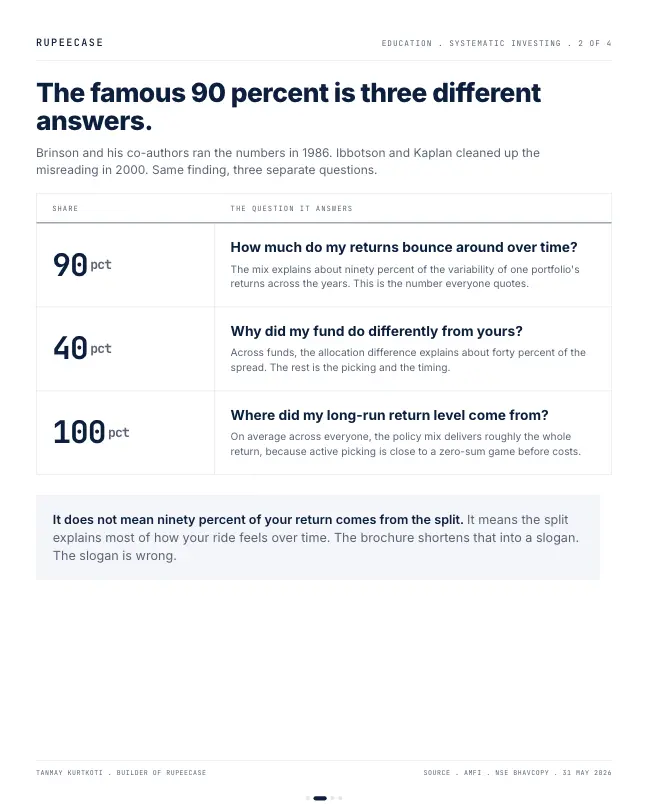
The big one is the split. How much equity, how much debt, how much gold. Brinson and his co-authors put numbers on this back in 1986, and the finding has held up through every market since. The mix you choose explains roughly ninety percent of how much your portfolio's returns swing around over time. Which specific fund you drop into each sleeve is the smaller lever, not the larger one.
Now the part the brochures quietly mangle. That ninety percent is not "ninety percent of your return comes from asset allocation." Ibbotson and Kaplan cleaned this up in 2000. It is about variability, how bumpy the ride feels over the years, not about where the magnitude of your return came from. Look across different funds instead of across time and the split explains closer to forty percent of why yours landed differently from mine. On average across everyone, the policy mix accounts for roughly the whole long-run level, because active picking is close to a zero-sum game before costs.
The cleanest way to see it is to hold the index in every sleeve, so the picking is identical, and just move the mix. All equity returns about 10.4 percent and makes you sit through a 52 percent drawdown to get it. A 40 40 20 mix returns about 8.5 percent and never falls more than 18 percent. Two points of return between them. Thirty four points of drawdown. Same holdings. The split did all of it.
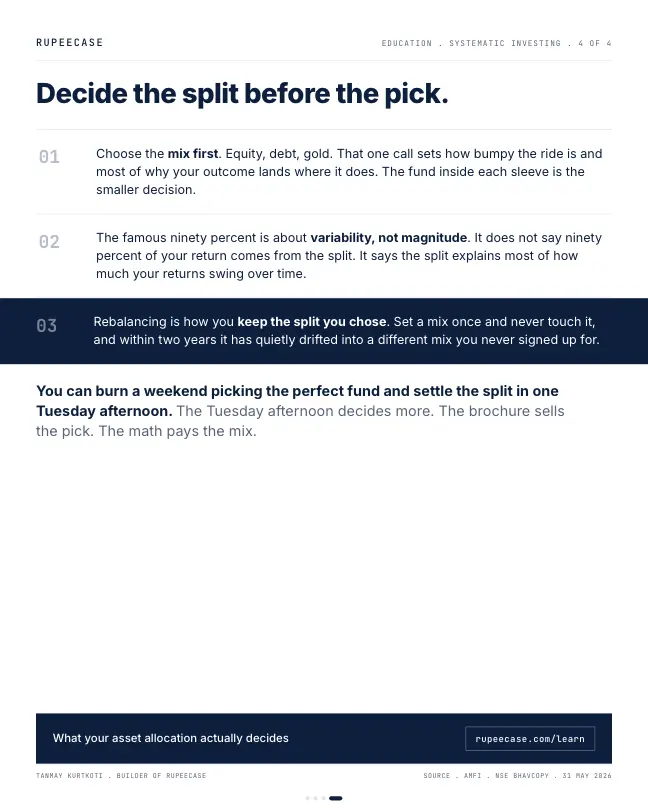
So the honest version. You can spend a weekend on the pick and one Tuesday afternoon on the split. The Tuesday afternoon decides more. The brochure sells the pick. The math pays the mix.
What your asset allocation actually decides:
MythAsset allocation explains 90 percent of your returns.
FactIt explains about 90 percent of how much a portfolio's returns swing over time. Across different funds it explains closer to 40 percent of why returns differ.
MythPicking the better fund in each sleeve is the main decision.
FactTwo large cap funds usually differ by a few points a year. Two mixes of the same indices can differ by ten or more in a single year.
One real year, same indices, five mixes
Here is the test from the opening on actual NSE data, with no fund picking at all. Each sleeve is an index. Equity is the Nifty 50. Debt is the Nifty Composite G-sec Index. Gold is an NSE listed gold ETF. The window is one year, 30 Sep 2025 to 30 Sep 2026.
Over that year the Nifty 50 fell 8.09 percent, the G-sec index rose 2.81 percent and the gold ETF rose 26.85 percent. Mix them and the result depends almost entirely on the weights.
- 100 equity-8.09%
- 80 equity, 20 debt-5.91%
- 60 / 30 / 10 with gold-1.33%
- 40 / 40 / 20 with gold3.26%
- 20 / 60 / 20 with gold5.44%
Price returns 30 Sep 2025 to 30 Sep 2026, weights fixed at the start, no costs. NSE closes for the Nifty 50, Nifty Composite G-sec Index and an NSE listed gold ETF. RupeeCase calculation.
An 11 point gap between all equity and 40/40/20, from the split alone. I would not read that year as a verdict on any mix. It was a bad year for Indian equity and a strong one for gold, and a different year can reverse the order. The lesson is the size of the lever, not its direction.
Moving the lever yourself
Now give equity a one point better fund, a strong result for a picker: change the equity return from minus 8.09 to minus 7.09. At 40 percent equity the portfolio moves by 0.4 points. Move 20 points from debt to equity instead and it moves by about 2.2, more than five times as much. Take those 20 points from gold and it moves by about 7. That is the ratio the friend's Sunday spreadsheet was missing.
How to read your own split
Brinson's method, still used to grade professional funds, breaks a portfolio's result into two parts. The allocation effect is what the weights did, given the index return of each sleeve. The selection effect is what the funds did against their own index. The free Learn module on performance measurement works through this attribution on a rupee example, with a quiz and a certificate.
For your own portfolio the first pass is short. Write down today's split across equity, debt and gold, compare it to the split you meant to hold, and decide whether the gap was chosen. The asset allocation calculator gives a starting split from a horizon and a risk level, and the cash dial, not the stock list shows why risk level should change the mix rather than the names.
Questions readers ask
Does asset allocation matter more than fund selection?
For most investors, yes. On NSE index data from 30 Sep 2025 to 30 Sep 2026, five mixes of the same three indices returned between minus 8.09 and plus 5.44 percent, a gap far wider than the usual difference between two funds in the same category.
What did Brinson's study actually find?
It found that the policy mix explained about 90 percent of the variation in a fund's returns over time. It did not say that allocation produces 90 percent of the return itself; later work by Ibbotson and Kaplan clarified the difference.
What is a 40/40/20 portfolio?
It is a mix with 40 percent in equity, 40 percent in debt and 20 percent in gold. It gives up some long run return against all equity in exchange for a much smaller worst fall.
The cards
4 cards. Swipe, or tap to open.
Related
- The cash dial, not the stock listRisk appetite picks how much of the highest Sharpe portfolio to hold, not which stocks; swapping to a defensive basket instead costs about Rs 7.8 lakh on Rs 10 lakh over twenty years.Portfolio construction . . 5 min
- The mix beats the pickBrinson's 90 percent is about variability over time, not return; the same index at 100/0/0 and 40/40/20 trades 2.2 points of return for a worst drop of 28 instead of 52.Portfolio construction . . 11 min
- The repo number is not the number that moves your moneyA 25 basis point cut lifts a liquid fund 0.03 percent and a long gilt 2.25 percent, and the yield curve usually priced the move weeks before the MPC met.Portfolio construction . . 5 min
Educational content only. Figures are illustrative and computed on historical or representative data for teaching purposes, not investment advice. Past performance does not guarantee future returns. Sourced from NSE, BSE, SEBI, AMFI and RBI public data.