

Portfolio construction..4 min read
Capital weight is not risk weight
A 60/40 portfolio's risk decomposes to about 95/5, and genuinely splitting risk down the middle takes roughly 22 percent in stocks and a 6 percent annual swing.
By Tanmay Kurtkoti, founder of QC Alpha and builder of RupeeCase
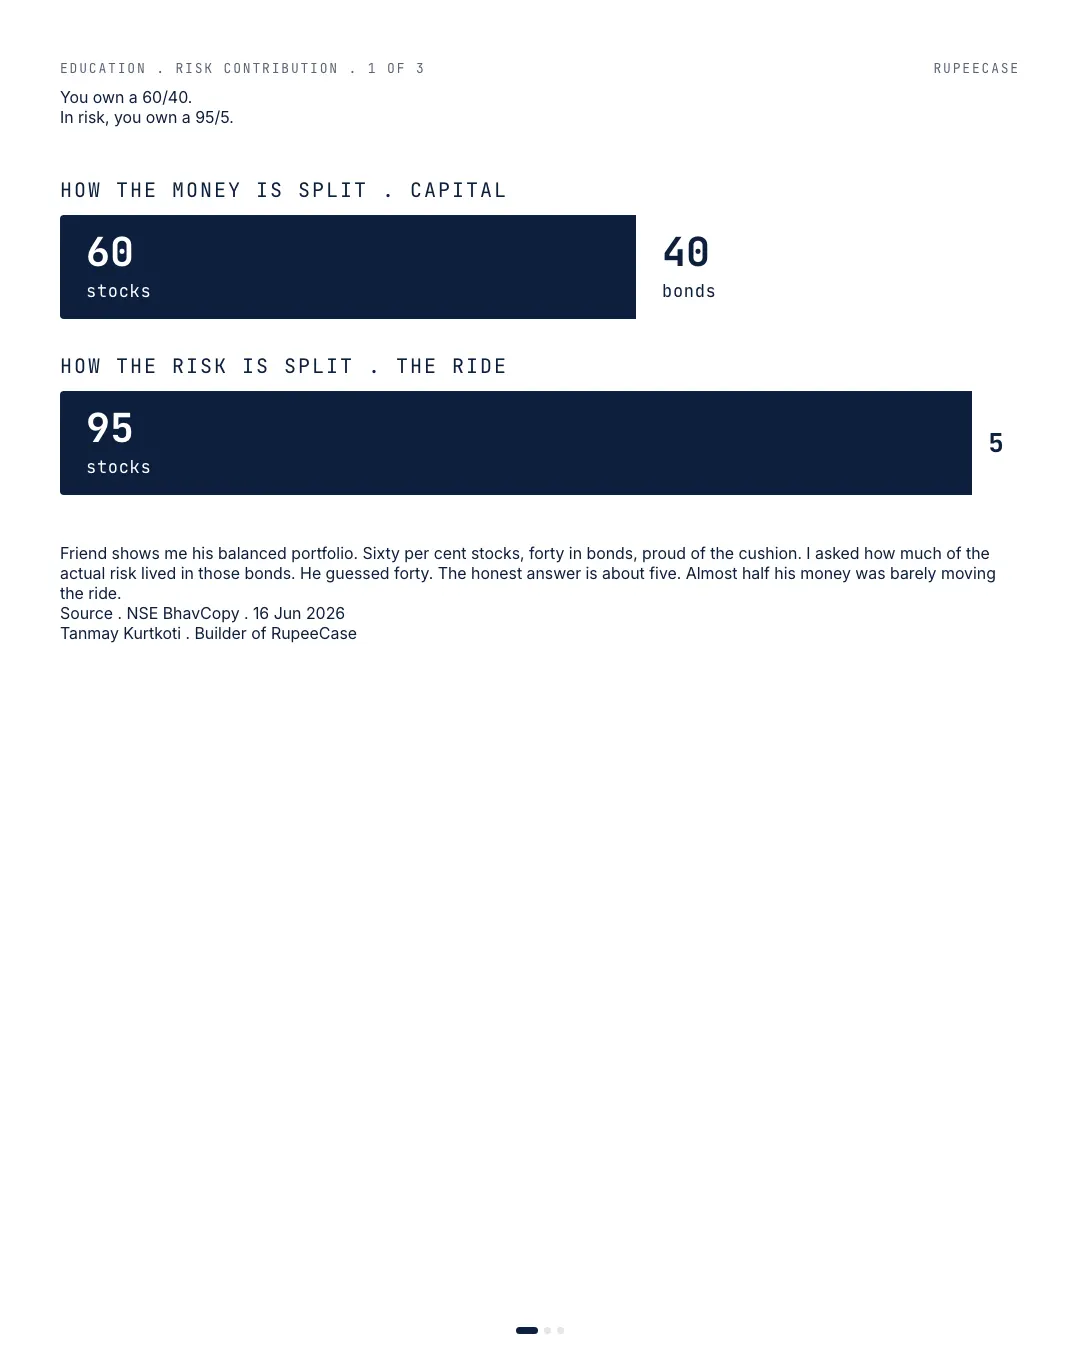
A friend showed me his portfolio last week, proud of how balanced it was. Sixty percent in stocks, forty in bonds, a proper cushion for the rough years. Then I asked him how much of his actual risk was sitting in those bonds. He guessed forty percent, same as the money. The honest answer is about five.
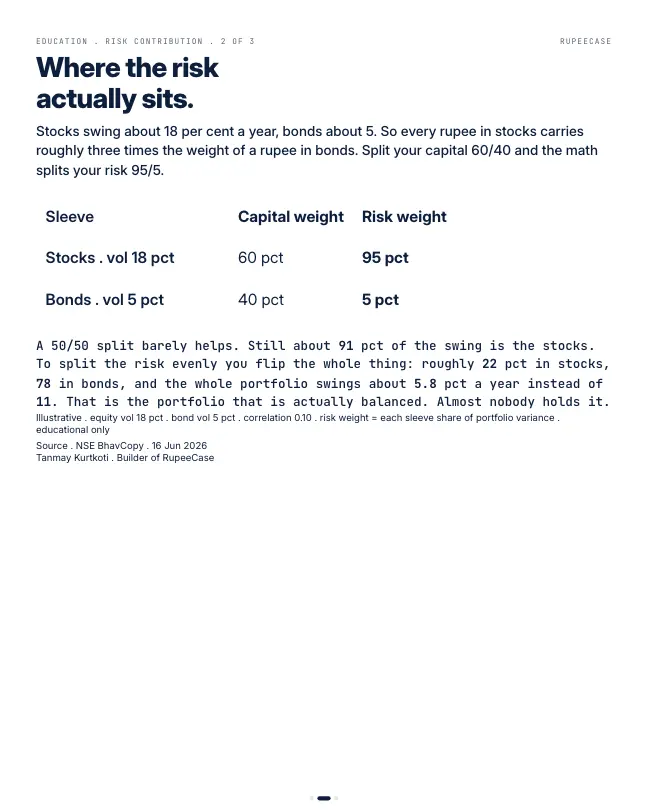
Here is the part the pie chart hides. Capital and risk are not the same split. Stocks swing around 18 percent a year, bonds maybe 5. So every rupee in stocks carries roughly three times the weight of a rupee in bonds. Run the decomposition on a 60/40 portfolio and the risk does not come out 60/40. It comes out 95/5. Ninety five percent of the swing is the equity sleeve. The bonds are along for the ride.
It gets worse before it gets better. Move to a 50/50 split and you are still at about 91 percent equity risk. To genuinely split the risk down the middle you would have to hold roughly 22 percent in stocks and 78 in bonds, and the whole portfolio would swing about 6 percent a year instead of 11. That is the allocation that is actually balanced, and in fifteen years I have met almost nobody who holds it.
None of this means 60/40 is wrong. It means the label is. A 60/40 is a growth portfolio with a small shock absorber, not a balanced one, and the day equities fall 30 percent your balanced fund will tell you exactly where its risk lived.
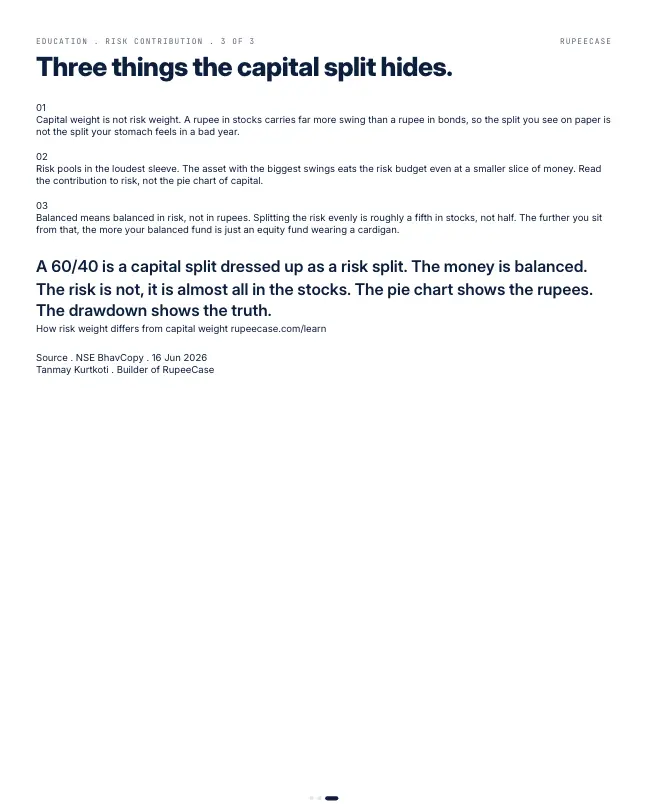
Three things I keep coming back to. Capital weight is not risk weight. Risk pools in the loudest sleeve. And balanced means balanced in risk, not in rupees.
The pie chart shows the money. The drawdown shows the truth. Read the contribution to risk before you call anything balanced.
How risk weight differs from capital weight:
Finding the split that is balanced in risk
For two assets there is a short rule for an equal risk split: hold each in proportion to the other's volatility. The equity weight is the debt volatility divided by the sum of the two volatilities. With 18 and 5, that is 5 divided by 23, or 21.7 percent. That is where the opening's 22/78 comes from.
Use the volatilities from NSE data instead. On quarter end closes from 14 Oct 2024 to 30 Sep 2026, the Nifty 50 swung about 16.5 percent a year and the Nifty Composite G-sec Index about 4.4 percent. The equal risk equity weight comes out at about 21 percent. Different inputs, nearly the same answer, because equity stayed close to four times as volatile as government bonds.
The two mixes on the same two years
Now test both splits on the same NSE closes, with the weights reset at each quarter end. One is the classic 60/40. The other is the risk balanced 21/79.
- 60/40, two year return-2.17%
- 21/79, two year return5.51%
- 60/40, worst quarter-9.30%
- 21/79, worst quarter-4.19%
NSE closes for the Nifty 50 and Nifty Composite G-sec Index, 14 Oct 2024 to 30 Sep 2026, weights reset quarterly, price only, no costs. Worst quarter: 31 Dec 2025 to 30 Mar 2026. RupeeCase calculation.
Do not read the return line as a lesson. Those two years were poor for Indian equity and decent for government bonds, so the low equity mix won. Over long stretches equity has earned more, and a 21/79 mix gives most of that up. The worst quarter line is the lesson. Balancing the risk halved the deepest fall, because the bonds were finally large enough to matter.
That is the honest trade. A risk balanced mix is calmer and earns less in strong equity years. A 60/40 earns more and behaves mostly like equity. Both are fine choices. Only one of them is balanced.
Reading your own pie chart
Write down your split, find a rough volatility for each sleeve, and multiply. On a 60/40 with 16.5 and 4.4, equity carries 60 x 16.5 = 990 units against debt's 40 x 4.4 = 176. Before correlation, that is already 85 percent equity on the simple product, and the correlation term pushes it higher. The free Learn module on modern portfolio theory works through risk contribution and the variance formula, with a quiz and a certificate. The Sharpe and volatility calculator handles the arithmetic. The companion post, 60/40 is a 94/6 bet, splits a real quarter's loss by sleeve.
Questions readers ask
How do I calculate the risk contribution of each asset?
Multiply each asset's weight by its volatility and by its correlation with the whole portfolio, then divide by the portfolio's volatility. For a quick read, the product of weight and volatility already shows where most of the risk sits.
What is risk parity in simple terms?
It is a way of sizing holdings so that each contributes the same share of the portfolio's risk, rather than the same share of its money. For equity and government bonds this usually means a small equity weight, around a fifth.
Why does a 60/40 portfolio behave like an equity portfolio?
Because equity is several times as volatile as debt, the equity sleeve produces most of the swings. On NSE data, equity was close to four times as volatile as the G-sec index between Oct 2024 and Sep 2026.
The cards
3 cards. Swipe, or tap to open.
Explore next
Learn it properly, then see it applied.
- StrategyAllcap strategyNifty Total Market, 50 stocks, every 2 weeks
- CalculatorAsset allocation by risk profileFree, with the formula and a worked example
- Free module 4.1Modern Portfolio Theory, What Actually Matters11 min read
- CalculatorSharpe and volatilityFree, with the formula and a worked example
- Blog topicPortfolio construction notes33 notes
Related
- 60/40 is a 94/6 bet with better brandingAt 18 percent equity volatility and 5 percent debt volatility, a 60/40 book carries 94 percent of its risk in equity, and a true risk split needs about 22/78.Portfolio construction . . 4 min
- The calm day contractThe same investor scored Moderately Aggressive on a quiet day and Conservative three weeks into a wobble, so fill the profile on a boring day and treat it as a contract.Portfolio construction . . 5 min
- Volatility is half the story, correlation decidesAdding 20 percent gold at 15 percent volatility to an 18 percent volatility equity book brings the blend down to 15.0, because gold rarely falls on equity's bad days.Portfolio construction . . 4 min
Educational content only. Figures are illustrative and computed on historical or representative data for teaching purposes, not investment advice. Past performance does not guarantee future returns. Sourced from NSE, BSE, SEBI, AMFI and RBI public data.