


Returns and risk maths..5 min read
SIP returns: XIRR vs the absolute number
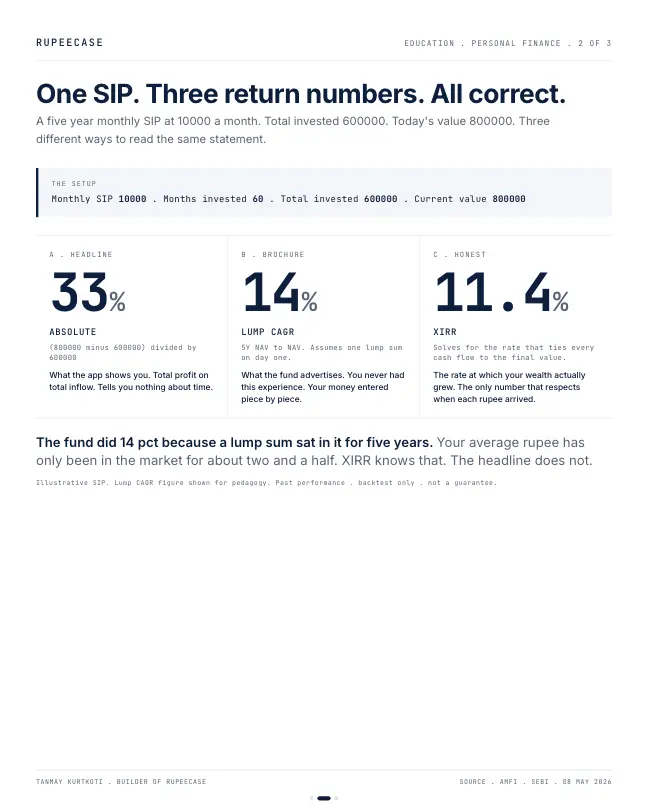
The same 60 month SIP statement shows 33 percent absolute, a 14 percent factsheet CAGR and an 11.4 percent XIRR, and only the last one is the return you earned.
By Tanmay Kurtkoti, founder of QC Alpha and builder of RupeeCase
Cousin showed me his SIP statement over chai last Sunday. Number at the bottom said 33 pct. He thought he was outperforming. I asked him to send the XIRR too. Eleven point four came back. Different conversation entirely.
The setup is plain vanilla. 10,000 a month for sixty months. Six lakh invested. Today's value eight lakh. The same statement holds three completely different return numbers, and most retail apps only ever show the first one.
The headline number is absolute return. Total profit divided by total inflow. 33 pct. It looks great. It hides every detail about when each rupee arrived in the market.
Then there is the number on the fund's factsheet. The advertised 5Y CAGR. Around 14 pct in this example. That number assumes a single lump sum sat in the fund for the full five years. Your money entered piece by piece, month by month. You never lived that experience. The brochure number was never yours.
The honest one is XIRR. 11.4 pct here. It solves for the rate that ties every cash flow to the final value. It respects when each rupee arrived. The fund did 14 pct because a lump sum sat in it. Your average rupee has only been in the market for about two and a half years, not five. XIRR knows that. The headline does not.
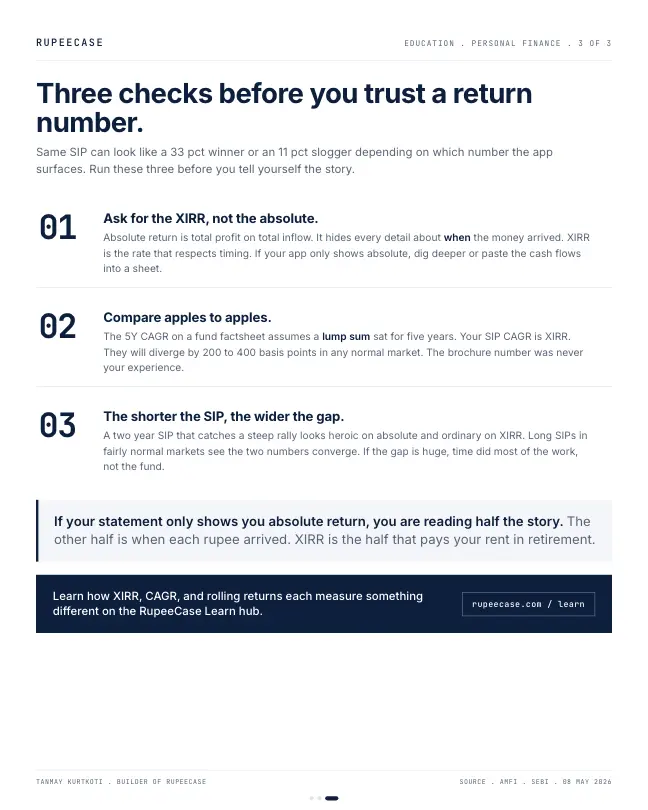
Three checks I run before I trust any return number now. Ask for the XIRR, not the absolute. Compare apples to apples, your SIP CAGR will diverge from a brochure CAGR by 200 to 400 basis points in normal markets. And the shorter the SIP, the wider the gap, because timing did most of the work.
If your statement only shows you absolute return, you are reading half a story. The other half is when each rupee arrived. XIRR is the half that pays your rent in retirement
Three numbers, one statement
Here are the three figures from the opening side by side, recomputed so you can check them.
Absolute: Rs 2,00,000 profit on Rs 6,00,000 put in
Worked example
Factsheet 5 year CAGR, a lump sum held five years
Worked example
XIRR: the yearly rate your own SIP earned
Worked example, RupeeCase calculation
The absolute figure is not wrong. It is just not a yearly rate. Spread over five years, thirty three percent sounds like about six percent a year, and on a lump sum it would be. On a SIP it is nearly double that, because most of the money was not there for five years.
Why your average rupee was invested for 30 months
The first Rs 10,000 went in on day one and sat in the fund for all 60 months. The last went in one month before the statement date. Every instalment in between sat for somewhere between the two. Add up the months and divide by 60 and the average is 30.5 months, about two and a half years.
That is why a SIP's XIRR and a fund's five year CAGR are different questions. The CAGR answers: what did one rupee left alone for five years earn? The XIRR answers: what yearly rate turns your exact payments, on their exact dates, into the value on your statement?
Find the rate yourself
XIRR is found by trial. Guess a yearly rate, grow every instalment at that rate for the time it was invested, and add them up. If the total is below your statement, raise the guess. If above, lower it. The rate where the total matches is the XIRR. Try it here:
Put 14 in the rate box. A fund that grew at a steady 14 percent every year would have turned the same SIP into about Rs 8,52,000, and the XIRR would be 14 too. So the gap in the opening tells you something about the path: the fund's best years came early, before most of the SIP money arrived. A SIP's result depends on the order of the returns, not only their average.
The gap grows with the number
The absolute return and the XIRR do not move together in a straight line. Here is the same 60 month SIP at four possible end values.
- Rs 7 lakh: absolute16.7%
- Rs 7 lakh: XIRR6.1%
- Rs 8 lakh: absolute33.3%
- Rs 8 lakh: XIRR11.4%
- Rs 9 lakh: absolute50.0%
- Rs 9 lakh: XIRR16.2%
Rs 10,000 a month for 60 months, Rs 6,00,000 put in. XIRR solved for each end value. Worked example, RupeeCase calculation.
A Rs 7 lakh statement shows 16.7 percent absolute. That is 6.1 percent a year, close to what a bank deposit might pay. The headline number makes a modest result look healthy. The free module on performance measurement covers XIRR alongside time weighted returns, alpha and the other figures on a statement. The start date problem behind the factsheet CAGR is in rolling returns vs CAGR, and why the same return can carry very different risk is in Sharpe ratio decoded.
Questions readers ask
What is the difference between XIRR and absolute return in a SIP?
Absolute return is total profit divided by total money put in, with no time attached. XIRR is the yearly rate that turns each instalment, on its own date, into the current value. Rs 10,000 a month for 60 months growing to Rs 8 lakh is 33.3 percent absolute and 11.4 percent XIRR.
Why is my SIP XIRR lower than the fund's 5 year CAGR?
The fund's CAGR assumes one lump sum invested for the full five years. In a SIP the average rupee has been invested for about half the period, and the result depends on whether the fund's good years came before or after most of your money arrived. If the strong years came early, your XIRR will be lower than the CAGR.
Is 33 percent absolute return over 5 years good?
For a monthly SIP it works out to about 11.4 percent a year, not the 6 percent a year it would be on a lump sum, and not 33 percent a year. Convert any absolute figure to an XIRR before comparing it with a deposit rate or an index.
The cards
3 cards. Swipe, or tap to open.
Explore next
Learn it properly, then see it applied.
- GuideCAGR vs XIRR: which return number to use, worked on a real SIPOne amount in, use CAGR. Money in on many dates, use XIRR. A real SIP, worked three ways.
- Free module 2.3Risk Metrics That Matter8 min read
- StrategyAllcap strategyNifty Total Market, 50 stocks, every 2 weeks
- CalculatorLumpsum calculatorFree, with the formula and a worked example
Related
- Rolling returns vs CAGRA point to point CAGR is a chosen story, and the Nifty 50 TRI's rolling five year windows since 2002 ranged from minus 1.2 to plus 22.4 percent a year.Returns and risk maths . . 5 min
- Sharpe ratio decoded: same CAGR, different rideTwo funds at 14 percent CAGR can carry Sharpe ratios of 0.58 and 0.32, and anything above 1.5 over a real ten year window earns the right to be questioned before it is trusted.Returns and risk maths . . 5 min
- Volatility drag: same average, six lakh gapTwo funds printing a 12 percent average return ended at Rs 28.4 lakh and Rs 21.8 lakh on the same Rs 10 lakh, because the drag scales with volatility squared.Returns and risk maths . . 6 min
Educational content only. Figures are illustrative and computed on historical or representative data for teaching purposes, not investment advice. Past performance does not guarantee future returns. Sourced from NSE, BSE, SEBI, AMFI and RBI public data.