

Returns and risk maths..6 min read
The bigger number is the smaller return
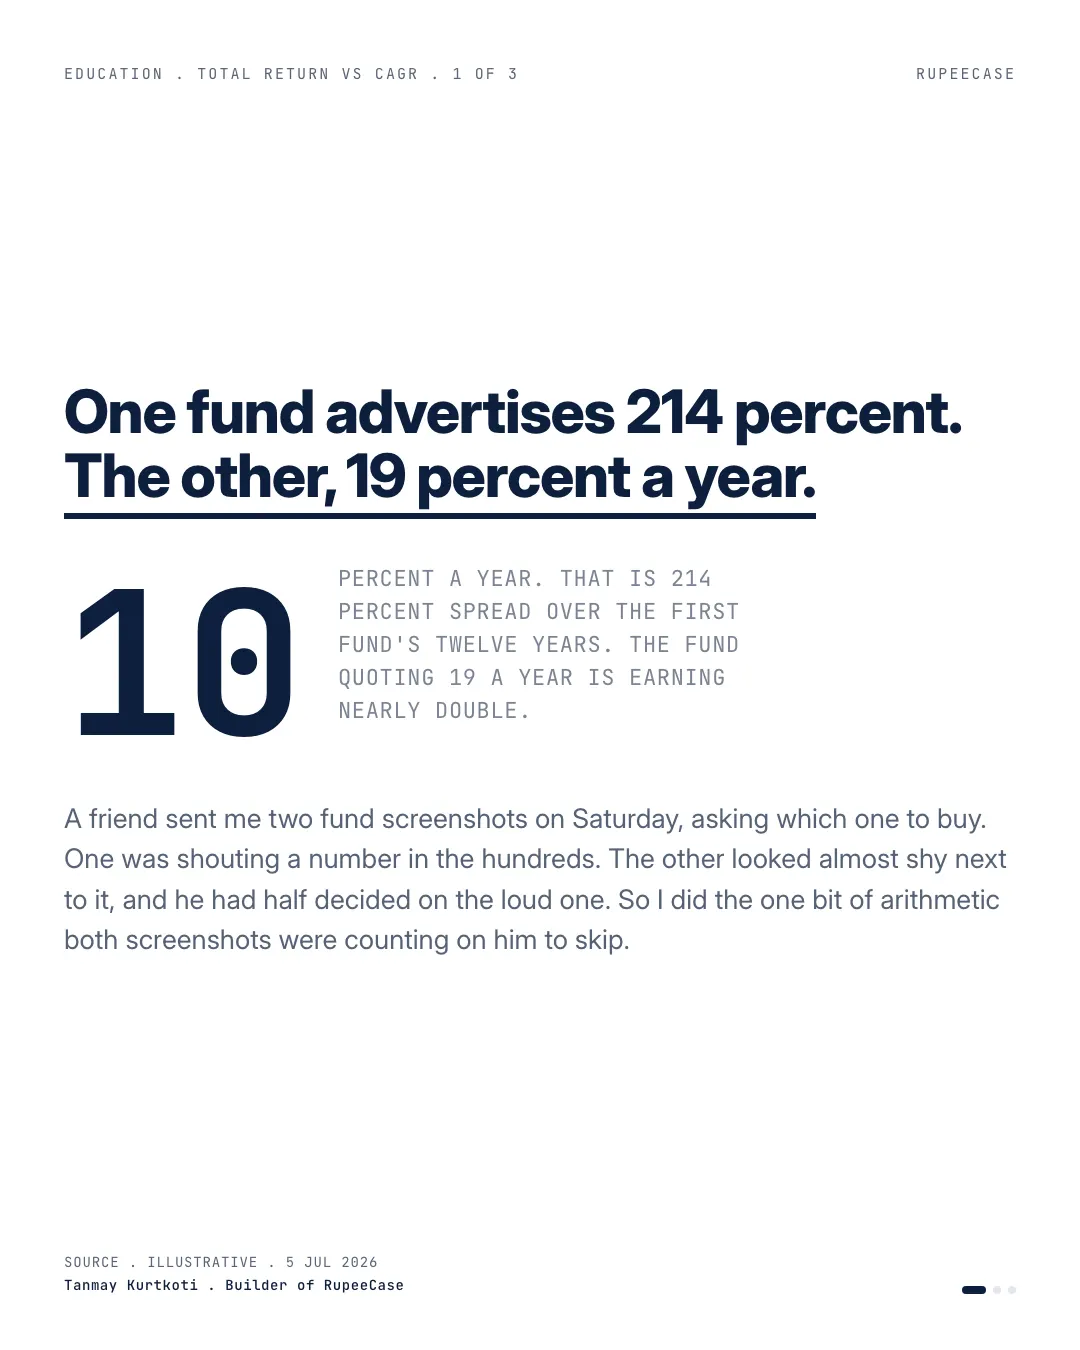
A fund up 214 percent over twelve years earned about 10 percent a year, roughly half the 19 percent a year of the fund with the smaller looking figure.
By Tanmay Kurtkoti, founder of QC Alpha and builder of RupeeCase
A friend sent me two fund screenshots on Saturday and asked which one to buy.
One was up 214 percent. The other, 19 percent a year. He had already half decided on the loud one, and I understood why. Two hundred and fourteen is a big, satisfying number. Nineteen looks almost apologetic next to it.
So I asked the only thing the screenshots were quiet about. Over how long?
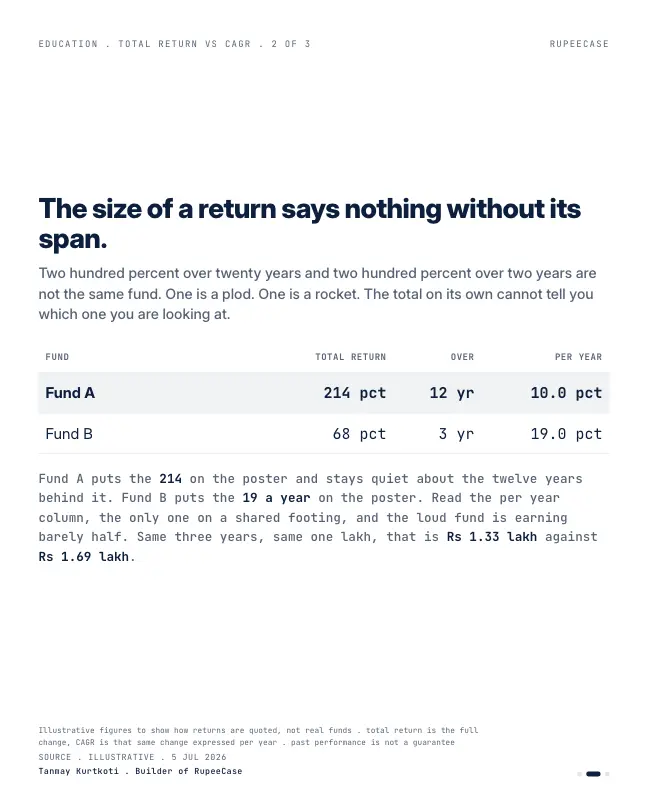
The 214 percent fund had been running for twelve years. Spread across those years, that is about 10 percent a year. The other fund's 19 percent was already a per year figure. So the fund with the giant total was earning barely half as much each year as the modest looking one. The bigger number was the smaller return. It had simply picked the flattering way to say itself.
Here is the part worth keeping. A total return and a per year return are two different languages, and most fund posters quote whichever one sounds bigger. An old fund shows you its enormous lifetime total. A young fund on a hot streak shows you its punchy annual figure. Neither is lying. They are just counting on you not to convert.
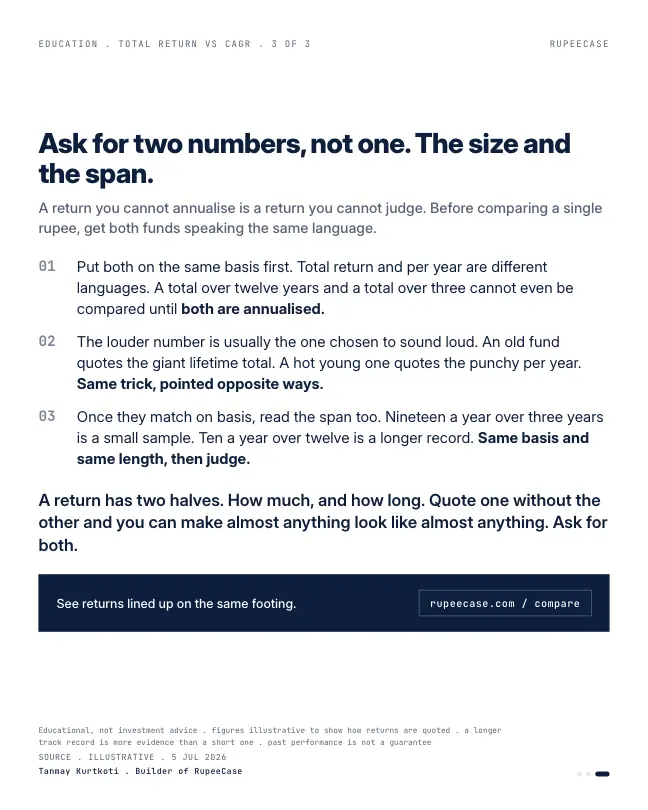
You cannot compare two funds until both numbers are annualised and both cover the same stretch of time. And even then the span cuts the other way too. Nineteen percent over three years is a small sample. Ten percent over twelve is a longer record. Same basis, same length, then you judge.
A return has two halves. How much, and how long. Quote one without the other and you can make almost anything look like almost anything.
Ask for both
The conversion, on paper
Here is the arithmetic I did on the phone before replying. You can redo it with a pen and any calculator that has a power key.
Start with the old fund. Up 214 percent means Rs 1,00,000 became Rs 3,14,000. That is a growth multiple of 3.14. The per year rate, the CAGR, is the number that multiplies itself twelve times to reach 3.14:
CAGR = 3.14 ^ (1 / 12) minus 1 = 1.100 minus 1 = 10.0 percent a year.
Now run the young fund the other way. Nineteen percent a year for three years is 1.19 x 1.19 x 1.19 = 1.685. Rs 1,00,000 became about Rs 1,68,500, a total of 68.5 percent. If it could keep that pace for twelve years, the multiple would be 1.19 ^ 12 = 8.06, and its poster would read "up 706 percent". It cannot print that number yet, so it prints the annual one.
a year, behind the 214 percent total over 12 years
Worked example: 3.14 ^ (1/12) minus 1
total, behind 19 percent a year over 3 years
Worked example: 1.19 ^ 3 minus 1
Same two funds, now in one language. Ten against nineteen, a year each. The decision changes completely, and nothing about either fund changed. Only the units.
The same trick works on losses
The conversion is not only for flattering numbers. It also shrinks scary ones, and that matters just as much.
The Nifty 50 price index closed at 23,644.80 on 31 Dec 2024 and at 22,620.45 on 30 Sep 2026, by NSE closing data. That is a fall of 4.3 percent in total. Over 21 months, it works out to about minus 2.5 percent a year. One sounds like a bad patch. The other sounds like a rounding error. Both describe the same 21 months.
And there is a second language hiding inside index numbers: price return against total return. The price index ignores dividends. The Total Return Index, the TRI, puts them back in. On 30 Sep 2026 NSE showed the Nifty 50 with a dividend yield of 1.22 percent, so the TRI version of that stretch was better by roughly that much each year. Still negative, but less so. SEBI has required mutual funds to show their performance against the TRI version of their benchmark since its circular of 4 Jan 2018, precisely so a fund that keeps its dividends cannot race an index that throws them away.
The free Learn module on indices and benchmarks walks through price index against TRI, how NSE builds each index, and which benchmark fits which kind of portfolio: Indices and Benchmarks.
What a model line looks like in both languages
Here is one of our own lines, so you can see the two languages side by side on a single record.
Rebased to 100, the Nifty 50 Equal Weight model ends near 213 and the smoothed Nifty 50 TRI line near 167.
The Nifty 50 Equal Weight model line goes from 100 to about 213. Said as a total, that is "up 113 percent". Said per year, it is a CAGR of 16.35 percent (Model, back tested, as of 27 Apr 2026). The Nifty 50 TRI reference line in the same file compounds at 9.8 percent a year. Same file, same window, both annualised. That is the only kind of comparison I trust, and it is why our strategy pages lead with CAGR and show the benchmark next to it rather than a lifetime total.
One honest caveat on that chart. The benchmark in the lineup file is a smoothed CAGR line, not the daily index, so it shows the pace, not the bumps.
Three checks before you compare any two returns
- Same unitsConvert totals to per year. Never put a lifetime total next to an annual rate.
- Same windowSame start and end dates. A 2021 start and a 2023 start are different markets.
- Same versionTotal return against total return. A fund against a price index flatters the fund.
- Then lengthThree years is a sample. Ten years, with a real fall inside it, is a record.
The fourth check is the one my friend's young fund fails even after conversion. Nineteen percent a year over three years tells you about three years. A longer related trap, the since inception figure that quietly starts on a lucky date, is the subject of the since inception trap. And the opposite mistake, averaging yearly returns instead of compounding them, is in the average year myth.
MythThe fund with the bigger percentage on the poster made more money.
FactOnly if both numbers use the same units and the same dates. A 214 percent total over 12 years is 10 percent a year, about half of 19 percent a year.
Questions readers ask
How do I convert a total return into a yearly return?
Add 1 to the total return written as a decimal, raise it to the power of 1 divided by the number of years, and subtract 1. A 214 percent total over 12 years is 3.14 ^ (1/12) minus 1, which is about 10 percent a year. Most phone calculators have the power key you need.
Is CAGR the same as average annual return?
No. CAGR is the steady yearly rate that gets you from the start value to the end value. The simple average of yearly returns ignores compounding and is almost always higher than the CAGR whenever returns swing from year to year.
Why do mutual funds compare themselves with a TRI and not the price index?
Because the fund collects dividends and the price index does not. SEBI's circular of 4 Jan 2018 made the total return version the benchmark, so the comparison is like for like. Against a price index a fund would look better by roughly the dividend yield every year.
The cards
3 cards. Swipe, or tap to open.
Explore next
Learn it properly, then see it applied.
Reading path
Stop 4 of 8 on What a return number hides
Related
- The average year mythIn twenty years of Nifty calendar returns only two landed near the 12 percent long run rate, with nine years above 20 percent and 2008 giving back about half.Returns and risk maths . . 5 min
- The since inception trapA six year old fund's 18.9 percent since inception rode a 75 percent birth year; on the same five years it did 10 against the fifteen year old fund's 13.Returns and risk maths . . 5 min
- The three year number that changes every dayEvery three year window on the Nifty 50 TRI from 2013 to 2025 ranged from 8.8 to 18.3 percent CAGR, and three months in 2020 moved it by 14 points.Returns and risk maths . . 10 min
Educational content only. Figures are illustrative and computed on historical or representative data for teaching purposes, not investment advice. Past performance does not guarantee future returns. Sourced from NSE, BSE, SEBI, AMFI and RBI public data.