

Returns and risk maths..5 min read
Sharpe ratio decoded: same CAGR, different ride
Two funds at 14 percent CAGR can carry Sharpe ratios of 0.58 and 0.32, and anything above 1.5 over a real ten year window earns the right to be questioned before it is trusted.
By Tanmay Kurtkoti, founder of QC Alpha and builder of RupeeCase
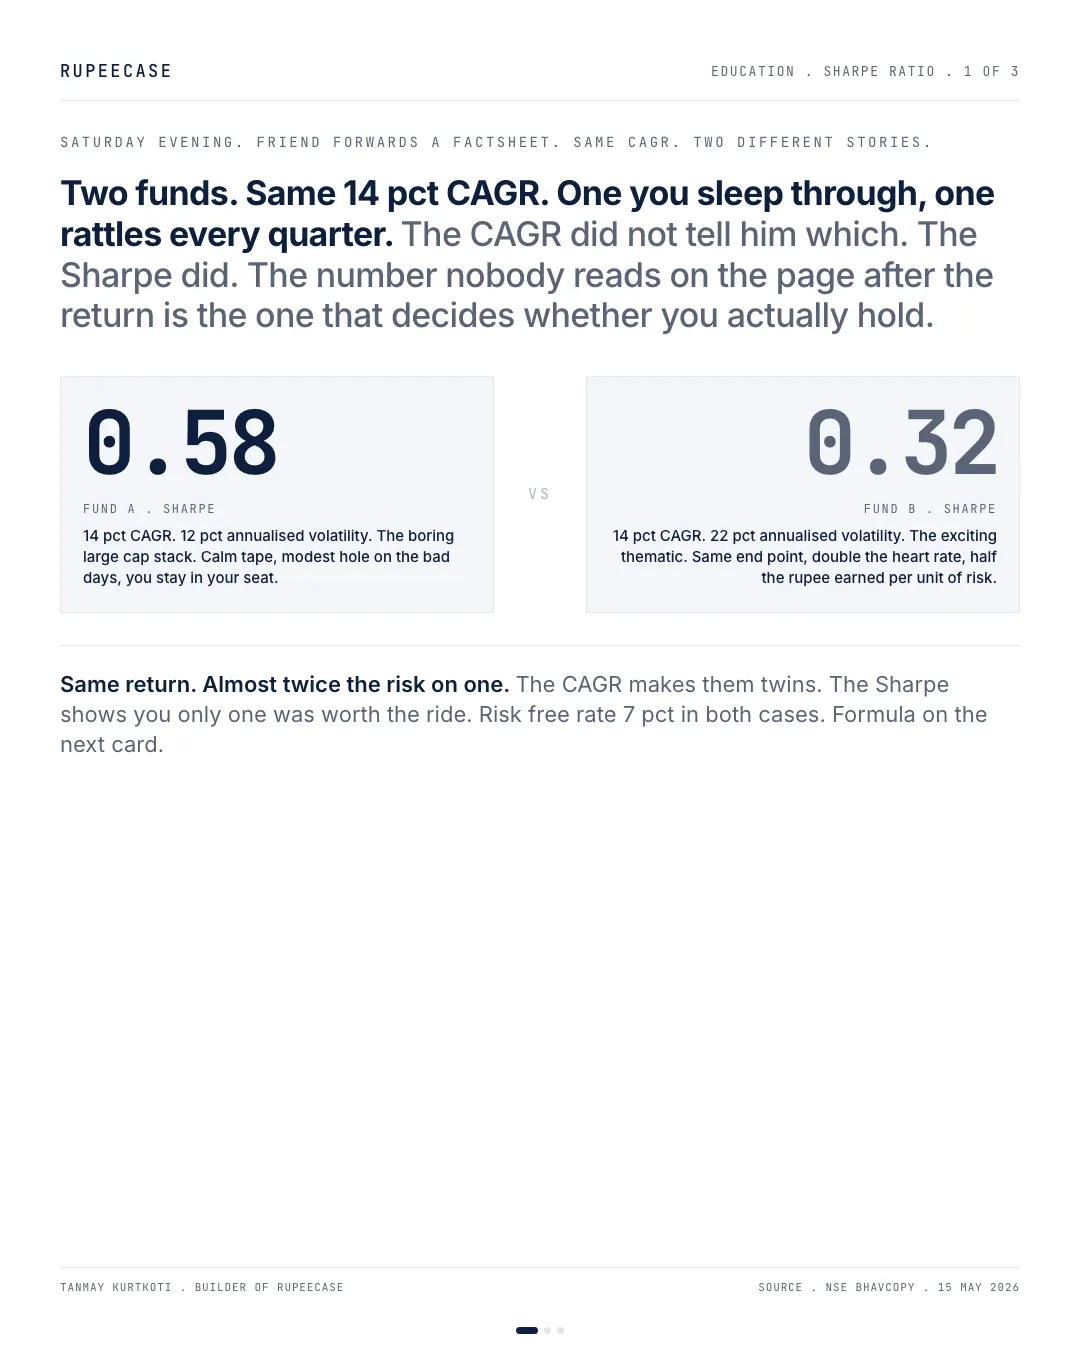
Friend forwarded a fund factsheet on Saturday evening. Highlighted the 14 pct CAGR over five years. I asked him for the volatility number next to it. Long pause. The factsheet had it. Page four, in 8 point grey type. He had never looked.
Two funds can print the same return and be two completely different products. The CAGR is the marketing copy. The Sharpe is the receipt.
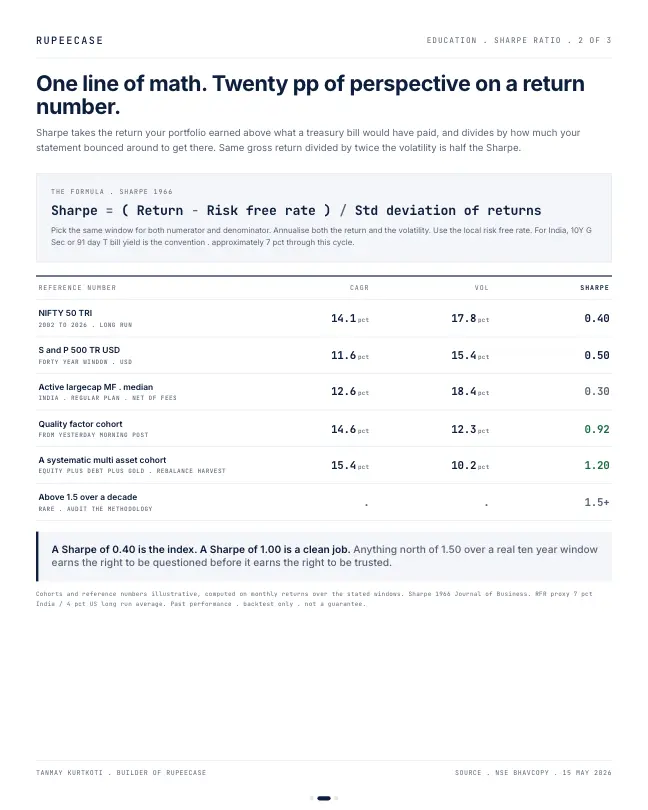
Same scenario. Two funds, both 14 pct CAGR. Fund A is a boring large cap stack at 12 pct annualised volatility. Fund B is an exciting thematic at 22 pct. Risk free rate 7 pct in both cases. Sharpe is just (Return minus RFR) divided by the volatility. Fund A . 0.58. Fund B . 0.32. Same end point on the chart, half the rupee earned per unit of risk to get there. The reason most investors quietly switch out of Fund B is not the return. It is the ride.
Reference numbers worth keeping in one place. NIFTY 50 TRI long run, Sharpe around 0.40. S and P 500 TR USD, around 0.50. Active largecap MF median in India net of fees, around 0.30. A clean quality cohort, 0.92. A systematic multi asset cohort with disciplined rebalance harvest, 1.20.
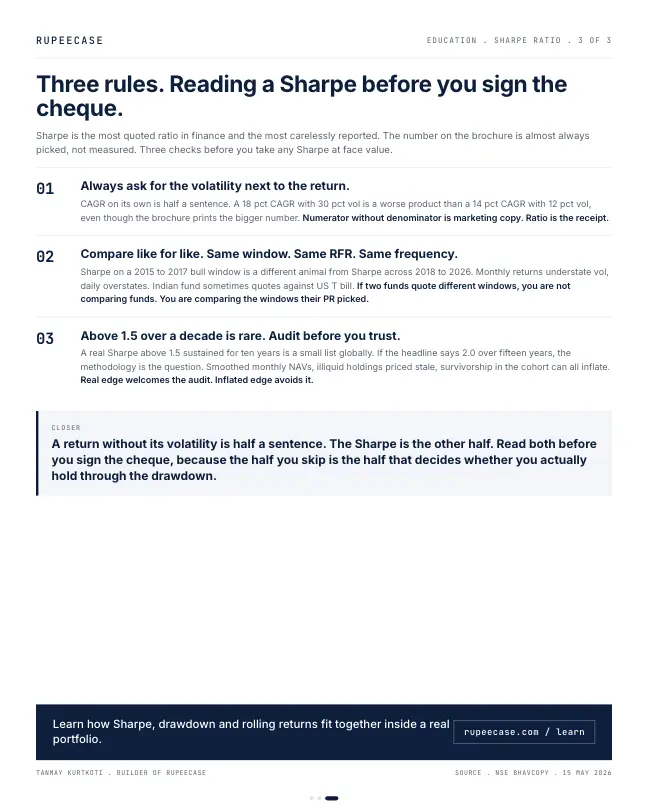
Above 1.5 over a real ten year window is rare globally. If the brochure prints 2.0, the methodology is the question. Smoothed monthly NAVs, illiquid holdings priced stale, survivorship in the cohort can all inflate the number. Real edge welcomes the audit.
Three rules to read any Sharpe by. Ask for the volatility next to every CAGR. Compare like for like . same window, same risk free rate, same return frequency. Anything above 1.5 over a decade earns the right to be questioned before it earns the right to be trusted.
The half you skip is the half that decides whether you actually hold
Redo Fund A and Fund B yourself
The arithmetic in the opening takes three numbers. Fund A: 14 minus 7 is 7 points of return above cash, divided by 12 points of volatility, gives 0.58. Fund B: the same 7 points divided by 22 gives 0.32. Fund B had to swing almost twice as hard to earn the same 7 points.
The last line is the useful one. To earn Fund A's Sharpe at its own level of swing, Fund B would need about 19.8 percent a year, not 14. Now change the risk free rate to 5.5. Both Sharpe ratios rise, Fund A to 0.71 and Fund B to 0.39, without either fund changing at all. That is why the opening insists on the same risk free rate before comparing two figures.
The denominator is not the same across the market
Volatility is the yearly swing of returns, measured as the standard deviation of daily changes scaled up to a year. It differs a lot between parts of the Indian market, which means the same return buys a very different Sharpe depending on where it came from.
- Nifty100 Low Vol 3011.97%
- Nifty 5013.19%
- Nifty Midcap 15017.23%
- Nifty200 Momentum 3018.86%
- Nifty Smallcap 25018.96%
- Nifty Alpha 5021.68%
Annualised volatility over the two years to 9 Oct 2026: sample standard deviation of daily changes x square root of 252. From NSE index closes.
Put that into the formula. An index with 21.68 percent volatility needs nearly twice the excess return of one with 11.97 to print the same Sharpe. A small cap or alpha style fund that matches a large cap fund on return has, by definition, delivered less per unit of risk. Fund B in the opening is not a made up extreme. It is roughly the gap between the calmest and the busiest NSE indices in the last two years.
Applying the audit to our own numbers
The opening says anything above 1.5 earns the right to be questioned. RupeeCase's own model strategies print numbers in that zone, so here they are, with the questions applied.
- Dynamic Asset Allocator2.32
- Allcap Multi Asset1.81
- Allcap1.68
- Midcap1.49
- Nifty 50 Equal Weight1.13
- Healthcare Basket0.89
Model, back tested, as of 27 Apr 2026. RupeeCase lineup.json. Not client returns and not a promise of future returns.
Run the three rules against them. Window: these histories are about four to five years of back test, not a real ten year window, and a short window can flatter any Sharpe. Method: they are model figures on monthly values, not live accounts, so costs and slippage are only what the model assumes. Like for like: they only compare fairly with figures on the same window and risk free rate. That is why every one of them carries the label "Model, back tested", and why I read them as an upper bound, not a forecast.
MythA higher Sharpe ratio always means a better fund.
FactOnly on the same window, risk free rate and return frequency. Stale prices, smoothed values and short windows all push the ratio up without any extra skill.
The free module on risk metrics that matter covers volatility, drawdown, Sharpe and the rest with calculators and a quiz. Sharpe treats an upside swing the same as a downside one; the two ratios that fix that are in Sharpe, Sortino and Calmar, and why the swing itself eats compounded return is in volatility drag.
Questions readers ask
How do you calculate the Sharpe ratio of a mutual fund?
Subtract a risk free rate from the fund's yearly return and divide by its yearly volatility. A fund returning 14 percent with 12 percent volatility, against a 7 percent risk free rate, has a Sharpe of 0.58. Use the same window and risk free rate when comparing two funds.
What is a good Sharpe ratio in India?
For long only equity, above 1 over a full cycle is strong and above 1.5 over ten years is rare. Short or back tested windows often print higher figures; RupeeCase's model strategies show 0.89 to 2.32 (Model, back tested, as of 27 Apr 2026), which is why the window and method matter as much as the number.
Why can two funds with the same CAGR have different Sharpe ratios?
Because Sharpe divides the return by the volatility it took to earn it. At the same 14 percent, a fund swinging 12 percent a year scores 0.58 and one swinging 22 percent scores 0.32, with a 7 percent risk free rate. Over the two years to 9 Oct 2026 NSE index volatility ranged from 11.95 to 21.57 percent.
The cards
3 cards. Swipe, or tap to open.
Explore next
Learn it properly, then see it applied.
- StrategyAllcap strategyNifty Total Market, 50 stocks, every 2 weeks
- CalculatorCAGR calculatorFree, with the formula and a worked example
- Free module 2.3Risk Metrics That Matter8 min read
- CalculatorSharpe and volatilityFree, with the formula and a worked example
- Blog topicReturns and risk maths notes20 notes
Related
- Sharpe, Sortino, Calmar: three leaderboardsThe same three funds rank differently under Sharpe, Sortino and Calmar, and in withdrawal phase Calmar is the bar because drawdown does not average out.Returns and risk maths . . 5 min
- Rolling returns vs CAGRA point to point CAGR is a chosen story, and the Nifty 50 TRI's rolling five year windows since 2002 ranged from minus 1.2 to plus 22.4 percent a year.Returns and risk maths . . 5 min
- Volatility drag: same average, six lakh gapTwo funds printing a 12 percent average return ended at Rs 28.4 lakh and Rs 21.8 lakh on the same Rs 10 lakh, because the drag scales with volatility squared.Returns and risk maths . . 6 min
Educational content only. Figures are illustrative and computed on historical or representative data for teaching purposes, not investment advice. Past performance does not guarantee future returns. Sourced from NSE, BSE, SEBI, AMFI and RBI public data.