

Returns and risk maths..5 min read
The average year myth
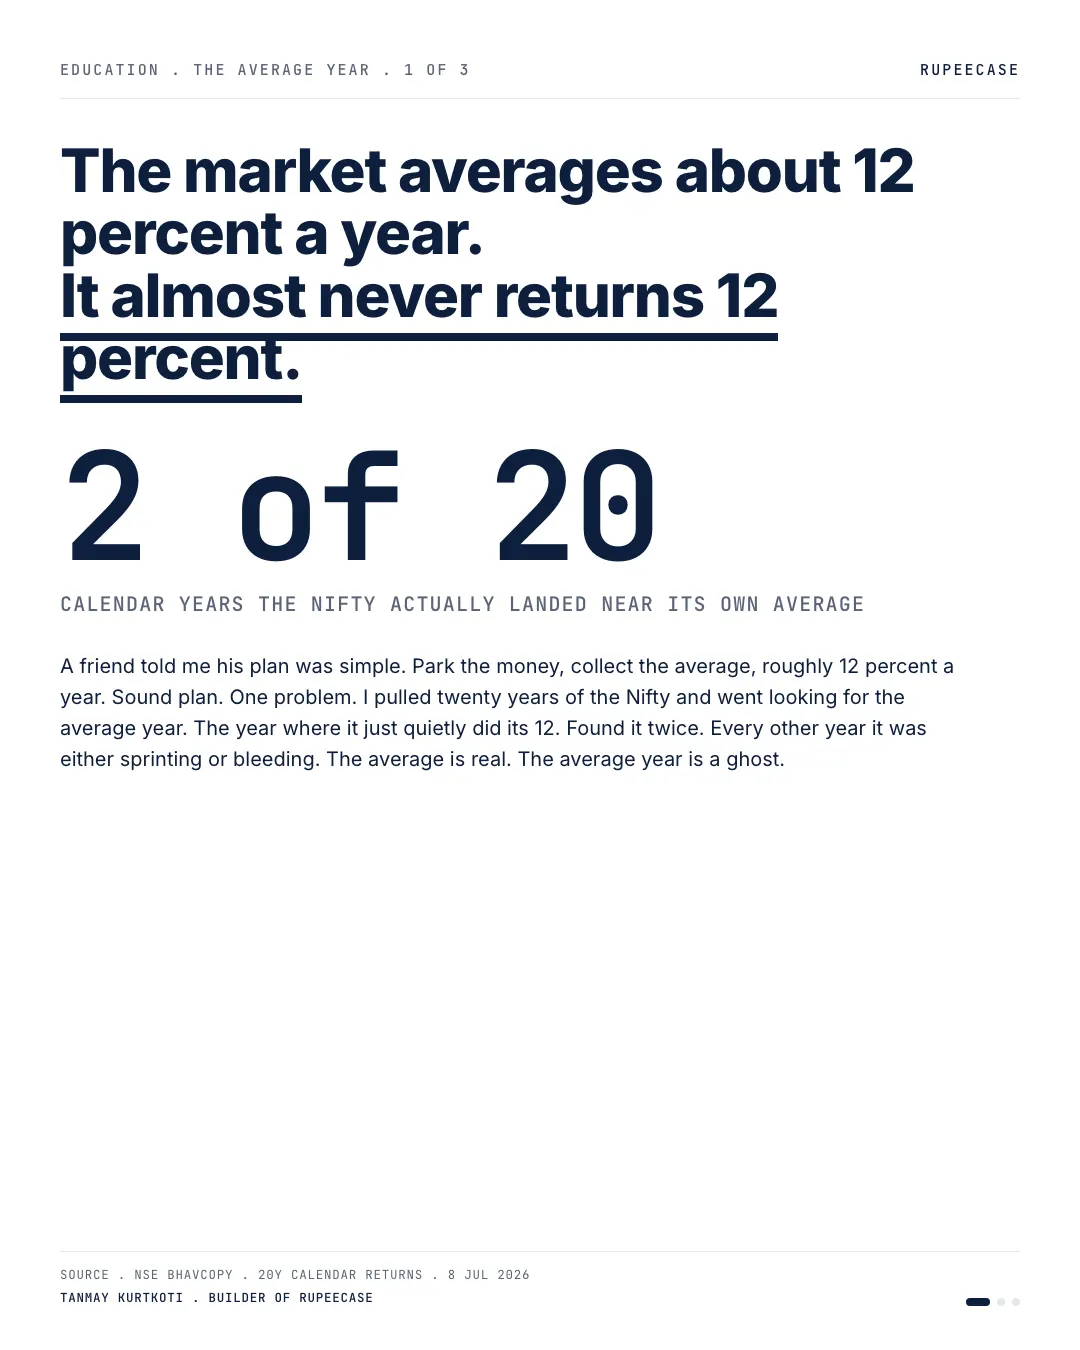
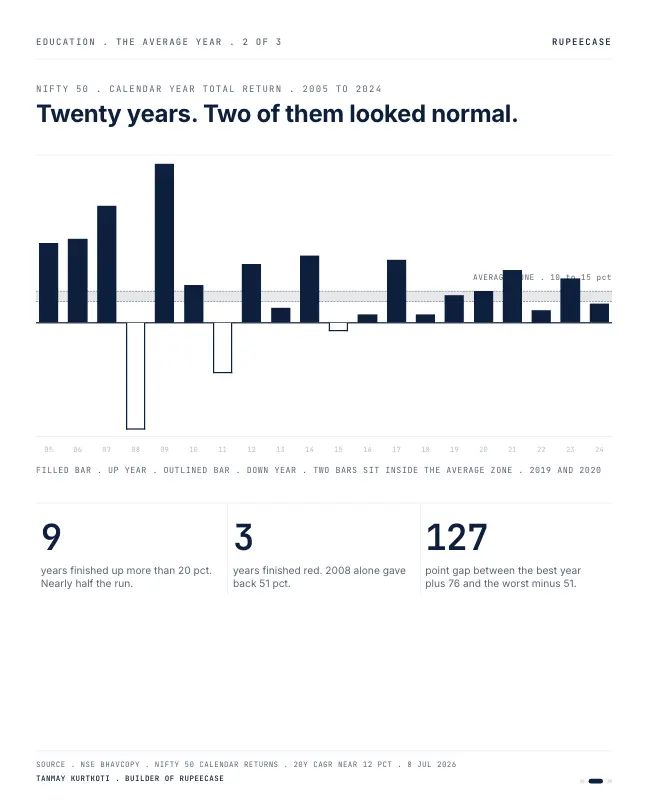
In twenty years of Nifty calendar returns only two landed near the 12 percent long run rate, with nine years above 20 percent and 2008 giving back about half.
By Tanmay Kurtkoti, founder of QC Alpha and builder of RupeeCase
A friend laid out his investing plan for me last week. Simple, he said. Park the money in the market, collect the long-run average, roughly 12 percent a year. Nothing wrong with the number. It is close to what the Nifty has actually done over twenty years.
So out of curiosity I pulled two decades of calendar returns and went looking for the average year. Not the average. The year where the market just quietly delivered its 12 and went home.
I found it twice.
Twenty years, and in only two of them did the index land anywhere near its own long-run rate. Every other year it was either sprinting or bleeding. Nine of those twenty years finished up more than 20 percent. Three finished in the red, and 2008 alone gave back about half. The best year was up 76. The worst was down 51. Somehow that violent spread averages out to a calm-sounding 12.
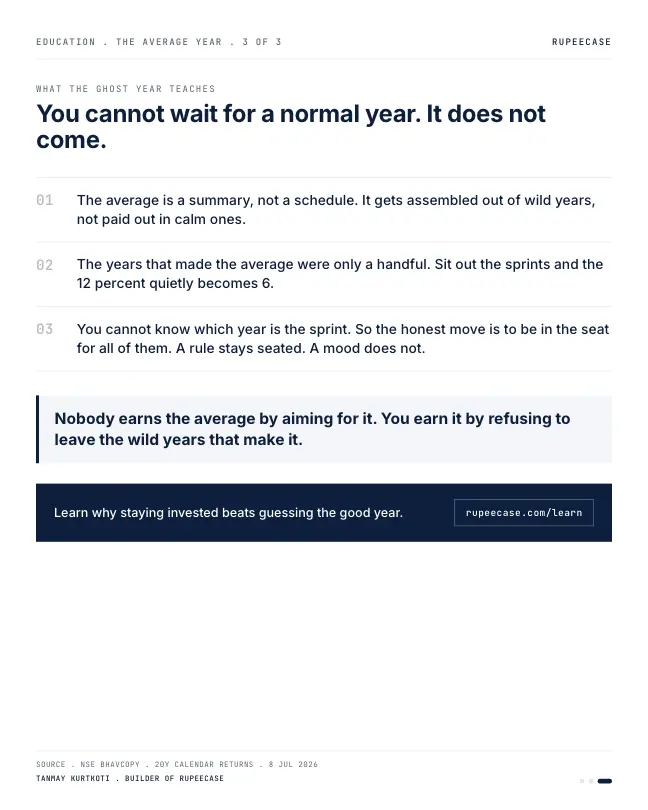
Here is the part most plans quietly ignore. The average is a summary, not a schedule. It does not get paid out in tidy monthly slices. It gets assembled out of a handful of enormous years, and if you are not holding through those years, you do not get the number. Sit out two or three of the sprints and your 12 quietly settles to a 6 without you ever making an obvious mistake.
The trouble is you cannot know in advance which year is the sprint. They arrive unannounced, usually right after the stretch that made you want to step aside. So the honest move is not to guess. It is to stay in the seat for all of them and let the average assemble itself.
That is really the whole case for a rule over a hunch. A rule stays seated. A mood gets up and leaves right before the year that mattered
The same test on recent years
The opening used two decades of calendar years. Here is a shorter window you can check line by line: six financial years of the Nifty 50 price index, from the close of Mar 2019 to the close of Mar 2025, using NSE closing values.
- FY 2019-20-26.0%
- FY 2020-2170.9%
- FY 2021-2218.9%
- FY 2022-23-0.6%
- FY 2023-2428.6%
- FY 2024-255.3%
Nifty 50 price index, March closes: 11,623.90 (2019), 8,597.75 (2020), 14,690.70 (2021), 17,464.75 (2022), 17,359.75 (2023), 22,326.90 (2024), 23,519.35 (2025). NSE.
Over those six years the index went from 11,623.90 to 23,519.35. That is a multiple of 2.02, and a CAGR of 2.02 ^ (1 / 6) minus 1 = 12.5 percent a year. Almost exactly the long run number in the opening.
Now look for a year that delivered 12.5. There is none. The closest are 18.9 and 5.3. One year fell 26 percent, the next rose 71. The plain average of the six is 16.2 percent, which is not the number either, because averaging ignores how a fall shrinks the base.
what the six years compounded to, a year
NSE March closes, 2019 to 2025
years that landed within 5 points of it
NSE March closes, 2019 to 2025
These are price index figures. Dividends, at the 1.22 percent yield NSE showed for the Nifty 50 on 30 Sep 2026, would add about a point a year on top, and they would not change the shape: every year was either well above or well below.
What the one big year was worth
Most of those six years' gain arrived in one of them. Here is the test I find most useful, set at the moment it would have been hardest.
What would you do?
It is 31 Mar 2020. The Nifty 50 has just closed at 8,597.75, down 26 percent in a year. Your Rs 10 lakh from Mar 2019 is worth about Rs 7.4 lakh.
- Step aside for a year and come back when it feels calmer
The index rose 70.9 percent in FY 2020-21. Sitting out only that year and holding the other five, Rs 10 lakh ends Mar 2025 near Rs 11.8 lakh: about 2.9 percent a year.
- Stay in the seat
Holding all six years, Rs 10 lakh ends Mar 2025 near Rs 20.2 lakh: about 12.5 percent a year, the average, assembled.
Nifty 50 price index March closes, NSE. Cash assumed to earn nothing in the year out. Past index data, not a forecast.
The gap between those two outcomes is one year out of six. No terrible trade, no wrong stock. Just one absence at the worst possible time, which happened to be the time it felt most sensible.
Why a rule helps here
The years that make the average tend to arrive when the news is at its worst. FY 2020-21 began in the middle of a crash. Nobody felt like buying, and nobody could know the next twelve months would be the best in the window. A mood reads the news. A rule reads the calendar.
- Decide in advanceWrite down when you buy, rebalance and sell, before the market tests you.
- Act on the dateRebalance on the scheduled day, whatever the headlines say.
- Size for the bad yearA rule only holds if the position is small enough to sit through a 26 percent year.
- Let it assembleThe average shows up only for those still holding on the big days.
That third step matters most to me. Staying seated is not courage. It is mostly sizing: an amount you can live with when the year in front of you looks like FY 2019-20.
The free Learn module on why rules beat gut feeling covers how rules handle exactly these moments, with quizzes and a certificate. The single best days version of this lesson is in missing the best days, and the conversion behind every number here is in total return against CAGR.
Questions readers ask
What is the average annual return of the Nifty 50?
It depends on the window. From the close of Mar 2019 to the close of Mar 2025 the Nifty 50 price index compounded at about 12.5 percent a year, by NSE closing values. Individual years in that window ranged from minus 26 to plus 71 percent, and none came close to 12.5.
Why is the average return different from what I actually earned?
The average of yearly returns ignores compounding, and you only earn the years you were invested. Missing one strong year can change the outcome a lot: sitting out only FY 2020-21 cuts the six year result on the Nifty 50 from about 12.5 to about 2.9 percent a year.
Do markets give a steady return every year?
No. Equity returns come unevenly, in a few large years and several flat or negative ones. The long run figure is what those uneven years compound to, which is why the holding period and staying invested matter as much as the rate.
The cards
3 cards. Swipe, or tap to open.
Explore next
Learn it properly, then see it applied.
- GuideHow long should you stay invested in equity? What every Nifty 50 holding period since 2012 showsEvery 1, 3, 5, 7 and 10 year window of the Nifty 50 since 2012: how often each one lost.
- Free module 2.3Risk Metrics That Matter8 min read
- StrategyAllcap strategyNifty Total Market, 50 stocks, every 2 weeks
- CalculatorSIP calculatorFree, with the formula and a worked example
Related
- The bigger number is the smaller returnA fund up 214 percent over twelve years earned about 10 percent a year, roughly half the 19 percent a year of the fund with the smaller looking figure.Returns and risk maths . . 6 min
- The since inception trapA six year old fund's 18.9 percent since inception rode a 75 percent birth year; on the same five years it did 10 against the fifteen year old fund's 13.Returns and risk maths . . 5 min
- The three year number that changes every dayEvery three year window on the Nifty 50 TRI from 2013 to 2025 ranged from 8.8 to 18.3 percent CAGR, and three months in 2020 moved it by 14 points.Returns and risk maths . . 10 min
Educational content only. Figures are illustrative and computed on historical or representative data for teaching purposes, not investment advice. Past performance does not guarantee future returns. Sourced from NSE, BSE, SEBI, AMFI and RBI public data.