

Returns and risk maths..5 min read
The since inception trap
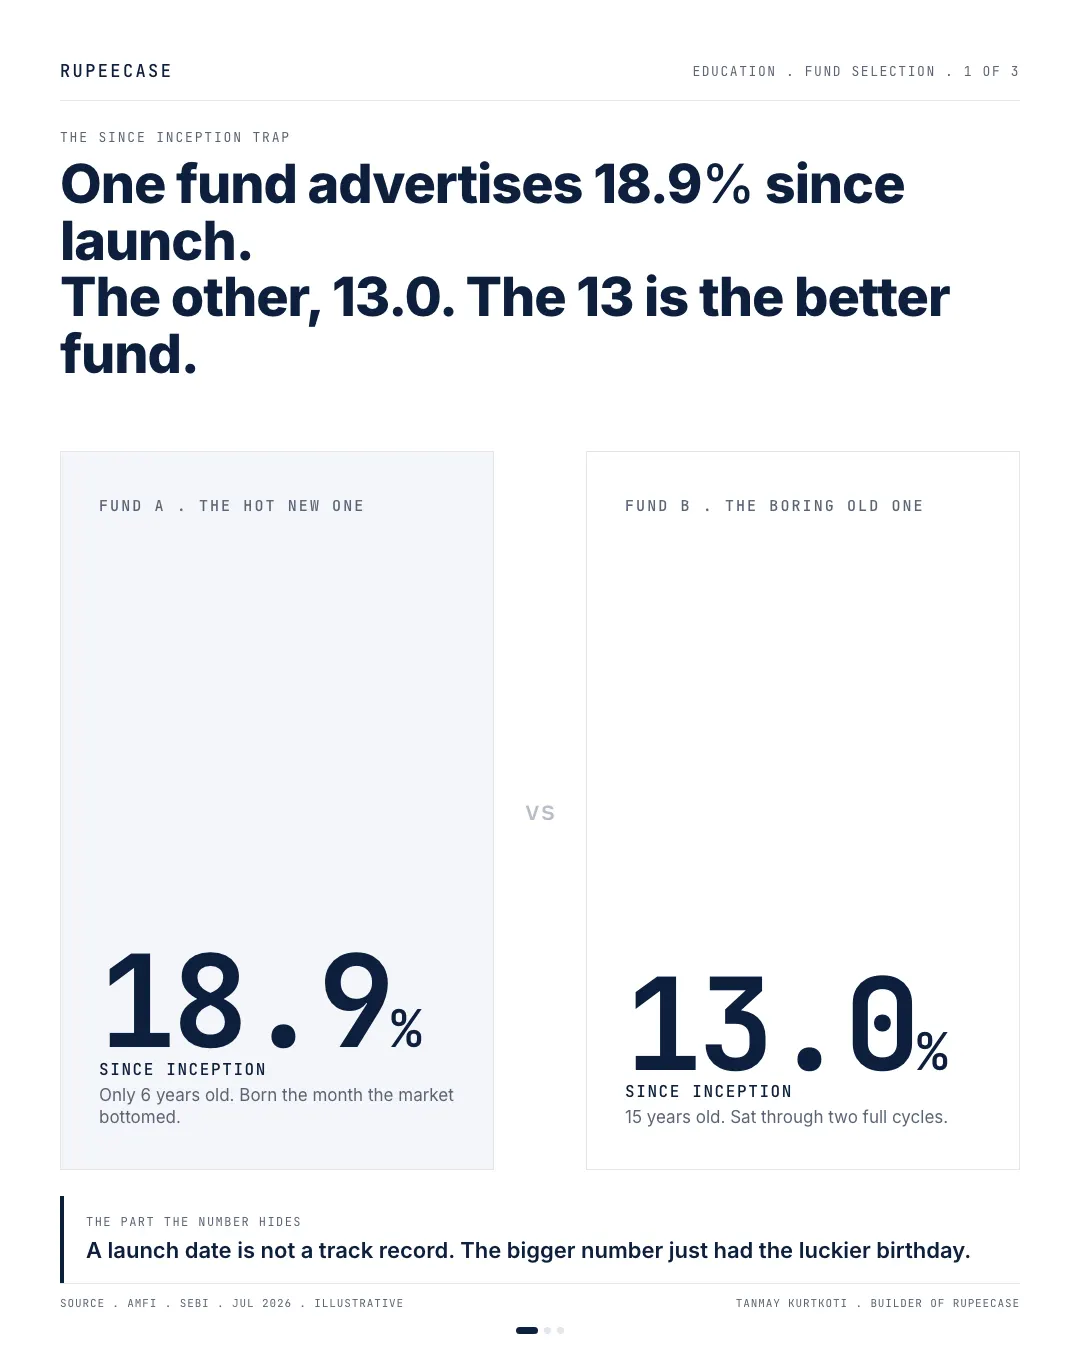
A six year old fund's 18.9 percent since inception rode a 75 percent birth year; on the same five years it did 10 against the fifteen year old fund's 13.
By Tanmay Kurtkoti, founder of QC Alpha and builder of RupeeCase
A fund's ad flashed "18.9% since inception" at me last week. Right below it on the same screener sat a fifteen-year-old fund saying 13. Most people stop reading there and tap the 18.9. I did the opposite and pulled both apart on Sunday morning.
Here is what the big number was hiding.
Fund A is six years old. It happened to launch the month the market bottomed out, rode a +75% first year on the recovery, and then did a thoroughly ordinary 10% a year after that. Fund B is fifteen years old and just plodded along at 13% through two full cycles, a crash and a boom included.
So the 18.9 and the 13 are not even the same measurement. One covers six years, the other covers fifteen. You are comparing a six-year sprint to a fifteen-year marathon and declaring the sprinter faster.
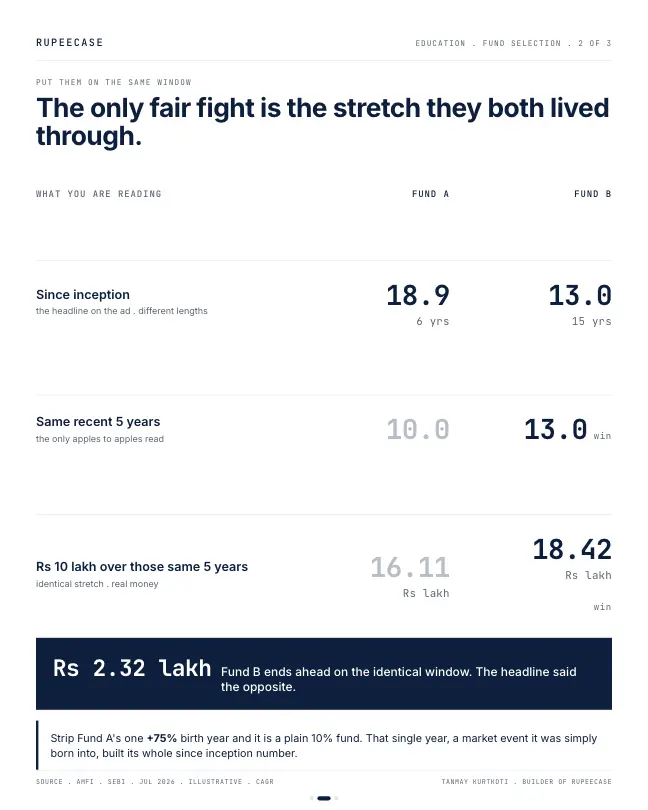
Put them on the only stretch they both actually lived, the same recent five years, and the ranking flips. Fund A did 10. Fund B did 13. Rs 10 lakh over that identical window grows to 16.11 lakh in A and 18.42 lakh in B. The boring fund ends 2.32 lakh ahead. Strip out Fund A's single lucky birth year and it was a plain 10% fund the entire time.
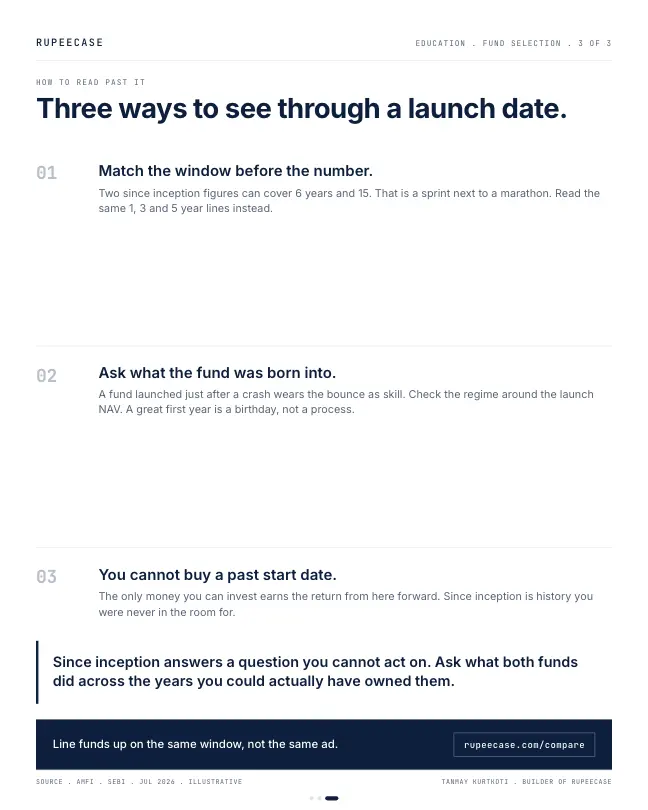
The deeper problem is that since inception answers a question you cannot act on. What if I had invested on the founder's first day. You cannot. That date is gone. The only money you can deploy earns whatever comes next, and the since-inception figure never promised you that.
So read the standard 1, 3 and 5 year lines where the windows actually match. Ask what regime the fund was born into. A monster first year off a bottom is a birthday, not a process.
How one birth year makes 18.9
Here is the arithmetic for Fund A, so you can see how much work its first year is doing.
Rs 1,00,000 grows 75 percent in year one, to Rs 1,75,000. Then five years at 10 percent: 1.75 x 1.1 ^ 5 = 1.75 x 1.611 = 2.818. Over six years that is a CAGR of 2.818 ^ (1 / 6) minus 1 = 18.9 percent.
Now drop the first year and the same fund is a 10 percent fund. One year out of six turned a 10 into an 18.9.
Push the age up and watch the effect fade. At twelve years the same birth year lifts a 10 percent fund to about 14.3. At thirty years, about 11.7. A since inception number is most misleading exactly when a fund is young and its launch date happened to be lucky.
Same model, same end date, five answers
I ran our own Smallcap model through this test. Same curve, same end point at Jul 2026, only the start date moves.
- From May 202138.6%
- From Jan 202340.2%
- From Jan 202411.3%
- From Sep 2024-1.4%
- From Jan 20255.2%
Smallcap model, CAGR from each month end to Jul 2026, monthly curve in RupeeCase lineup.json. Model, back tested, as of 27 Apr 2026.
Nothing about the rules changed between those rows. The start date did. A start in early 2023 caught the 2023 run, when the model's calendar year return was about 113 percent. A start in Sep 2024 began near a peak and sat through the fall that followed. The full record from May 2021 says 38.6 percent a year, and the file figure, measured to 27 Apr 2026, is 37.40 percent with a maximum drawdown of minus 22.34 percent (Model, back tested, as of 27 Apr 2026).
That is why our strategy pages show the whole curve with the drawdowns, not one figure from a chosen date. Any single CAGR is a choice of window, and the window can be chosen.
Three checks before trusting a since inception figure
- When was it born?Find the launch date. A launch near a market bottom flatters every since inception number that follows.
- How old is it?A young fund's figure leans heavily on its first year or two. An old fund's figure includes full cycles.
- Line up the windowsCompare 1, 3 and 5 year returns ending on the same date, for every fund on your list.
- Look for the fallDoes the window include a real drawdown? A record with no bad year in it is a sample, not a record.
On the same five years in the opening, Fund A did 10 percent and Fund B did 13. Rs 10,00,000 x 1.10 ^ 5 = about Rs 16.11 lakh. Rs 10,00,000 x 1.13 ^ 5 = about Rs 18.42 lakh. The fund with the smaller headline was ahead on the only stretch both of them actually lived.
MythA higher since inception return means the fund has been better.
FactIt may only mean it was launched at a better moment. Compare funds over the same dates. Fund A's 18.9 percent was a 10 percent fund with one lucky birth year.
The free Learn module on performance measurement covers CAGR, rolling returns and fair comparison windows, with quizzes and a certificate. Two related reads: total return against CAGR and the average year myth.
Questions readers ask
What does since inception return mean?
It is the yearly compounded return from the day a fund started to a recent date. It covers a different length of time for every fund, so two since inception figures are usually not comparable. Comparing returns over the same 1, 3 or 5 years is fairer.
Why can a new fund show a very high since inception return?
Because a young fund's figure rests on only a few years, and one strong year counts for a lot. A fund launched near a market low can carry its first year's rally in that number for years. In the worked example, one 75 percent year turns a 10 percent fund into an 18.9 percent since inception figure over six years.
How should I compare an old fund with a new one?
Use the windows both have lived through: returns over the same recent 1, 3 and 5 years, ending on the same date. Look at the worst fall in each window too, since a short record may not include a bad year at all.
The cards
3 cards. Swipe, or tap to open.
Explore next
Learn it properly, then see it applied.
Reading path
Stop 3 of 8 on What a return number hides
Related
- The three year number that changes every dayEvery three year window on the Nifty 50 TRI from 2013 to 2025 ranged from 8.8 to 18.3 percent CAGR, and three months in 2020 moved it by 14 points.Returns and risk maths . . 10 min
- The average year mythIn twenty years of Nifty calendar returns only two landed near the 12 percent long run rate, with nine years above 20 percent and 2008 giving back about half.Returns and risk maths . . 5 min
- The bigger number is the smaller returnA fund up 214 percent over twelve years earned about 10 percent a year, roughly half the 19 percent a year of the fund with the smaller looking figure.Returns and risk maths . . 6 min
Educational content only. Figures are illustrative and computed on historical or representative data for teaching purposes, not investment advice. Past performance does not guarantee future returns. Sourced from NSE, BSE, SEBI, AMFI and RBI public data.