

Returns and risk maths..11 min read
Sequence of returns: the order you live through
Reshuffling the same ten years leaves a lump sum unchanged, ends a retiree with 28 or 140 lakh, and makes an early crash a gift for someone still paying in.
By Tanmay Kurtkoti, founder of QC Alpha and builder of RupeeCase
Past eleven at night my phone lights up. A friend, four weeks into the first SIP he has ever set up, has watched the market slide a few percent and he is spooked. His message is one line. "Should I pause it till this settles down." I typed back something that made him think I had lost it. I told him a crash right now might be the best thing that happens to that SIP all decade.
He did not believe me. Most people would not.
Everything we get sold about investing is an average. The fund shows you a CAGR. The brochure shows you returns since inception. The calculator asks for one number, an expected return, and hands you a tidy final figure. All of it quietly assumes the years arrive in a smooth, well behaved line.
They never do. And the order they actually arrive in is doing more to your money than the average ever will.
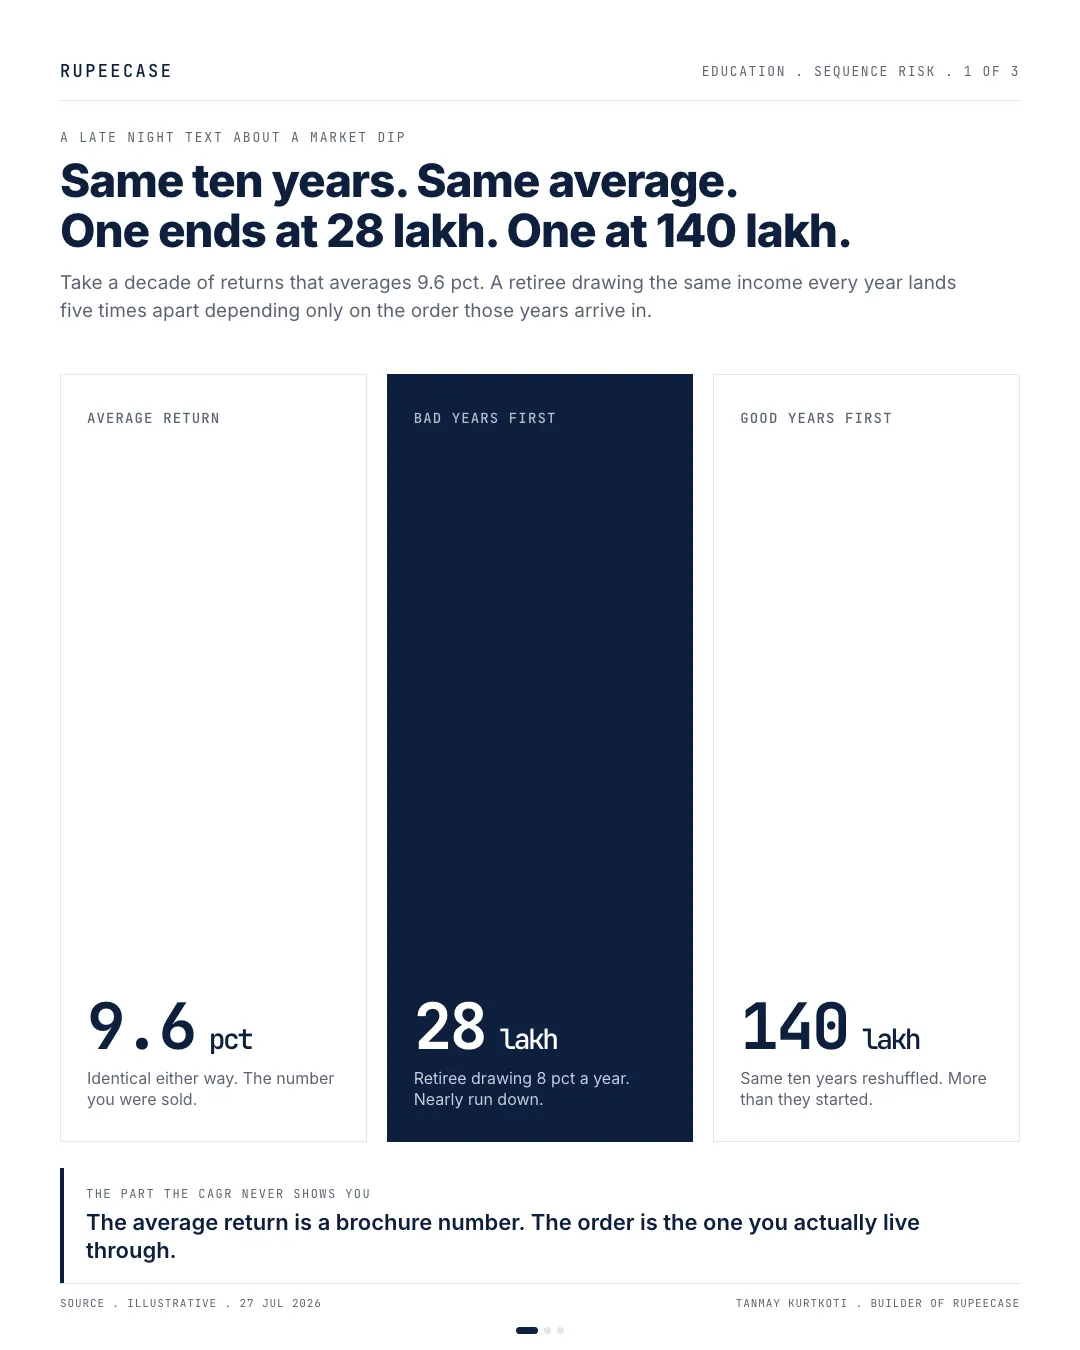
The average return is a brochure number. The order is the one you actually live through.
First, the boring truth that makes the rest surprising
Here is the part I had to show him before any of it made sense. If you invest a lump sum and never add to it or take from it, the order of your returns does not matter even slightly.
Take ten years. Two down years, a clutch of good ones, roughly the kind of decade the market actually delivers. Average them and you land near 9.6 percent a year. Now run those same ten years twice, once with the bad years stacked at the front and once with them at the back, and watch where a hundred rupees ends up.
| Ordering | Average return | Compound return | Ending value on Rs 100 |
|---|---|---|---|
| Bad years first | 9.6 pct | 8.06 pct | Rs 217.11 |
| Good years first | 9.6 pct | 8.06 pct | Rs 217.11 |
| Difference | 0 | 0 | Rs 0.00 |
Source . illustrative . the same ten returns, reshuffled.
Identical. Down to the paisa. This is not a coincidence and it is not illustrative luck, it is just multiplication, which does not care what order you multiply in. Two down years and eight up years compound to the same place whether the pain shows up first or last. The full arithmetic of how compounding stacks up is worth sitting with once, and I have walked through it on the learn pages. If your money sits still, the average really is the whole story.
This is the quiet assumption baked into almost every projection you have ever been shown. Punch a number into a SIP calculator and it draws you a clean rising curve, as if the market pays out the average in neat annual instalments. It does not. It pays you a wild scatter of years that happens to average out somewhere near that number, and the smooth line on the calculator is a picture of a market that has never once existed.
The trouble is that almost nobody's money sits still.
The retiree meets the same ten years and gets a completely different life
Start pulling money out and the tidy symmetry falls apart.
Picture someone who just retired with one crore, drawing eight lakh a year to live on. That is a punchy withdrawal rate and I picked it on purpose, so you can see the effect with your naked eye. Same ten years as before. The only thing I am going to change is the order they arrive in.
Bad years first, the retiree ends the decade with about 28 lakh left. Good years first, about 140 lakh, more than they started with, after taking out the exact same income every single year. Five times the outcome from the identical set of returns. The person who met the crash in year one was forced to sell units cheap just to pay the bills, and those units were never around for the recovery. The person who met the crash in year ten had already banked nine good years, so the fall landed on gains rather than on the seed.
Shrink it to two years and you can watch the mechanism in one step. With nothing coming out, the two orders end at the same place. Add a withdrawal and they split.
That is the cruel bit. A retiree cannot ask the market to come back next year. The grocery bill lands on schedule, so the units get sold whether the price that month is fair or a fire sale, and every unit sold cheap in a bad early year is a unit that is simply not there when the good years finally arrive.
This has a name. An American planner named William Bengen wrote it up in 1994, the study that gave the world the famous four percent rule, and the thing he was really describing was this. Averages mislead a retiree, because a retiree cannot wait for the average to show up.
MythIf my average return is higher than my withdrawal rate, the corpus cannot run down.
FactThe average says nothing about order. With 8 percent a year coming out of the same ten years, the corpus ended at about 28 lakh or about 140 lakh depending only on when the bad years came.
Now watch what those same years do to the person still paying in
Here is where it gets fun, and where my friend walks back into the story.
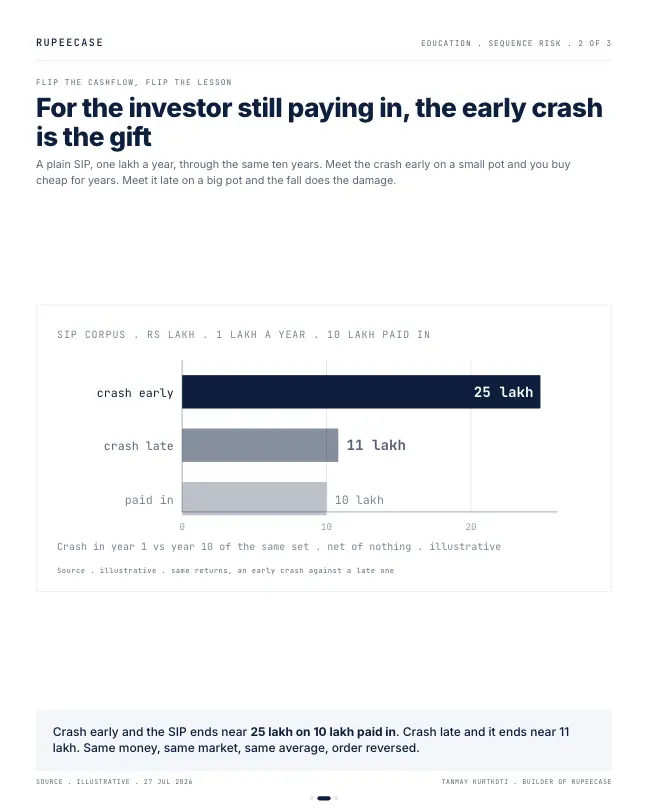
Flip the cashflow. Instead of drawing money out you are putting it in, one lakh a year for ten years, a plain SIP. Same ten years of returns, same reshuffle. Now the early crash is not the villain. It is the hero.
Crash early, while the pot is tiny, and you spend years buying units cheap before the recovery lifts all of them. That SIP ends near 25 lakh on ten lakh paid in. Crash late, after the pot has grown fat, and the fall lands when you have the most on the table. That SIP ends near 11 lakh, barely more than you put in. Same money, same market, same average. The order flipped the result by more than double.
So when my sheepish friend asked whether he should pause his brand new SIP because the market dipped, the honest answer was the opposite of his instinct. An early drop, for someone who is going to keep buying for years, is a discount and not a disaster.
Every rupee his SIP puts in during a red month buys more units than the same rupee buys in a green one. He is not bleeding, he is loading up cheap, and the one thing that turns that into a win is simply that he keeps going. Stop the SIP in the drop and you convert a discount into a locked loss, which is exactly the move the late night text was about to make.
You can see it on real closes. Treat one unit as the Nifty 50 divided by 100 and put Rs 10,000 in at each month end. The cheapest month of the 2025 fall bought the most.
- Dec 2024, 23,644.8042.29
- Jan 2025, 23,508.4042.54
- Feb 2025, 22,124.7045.20
- Mar 2025, 23,519.3542.52
- Apr 2025, 24,334.2041.09
- May 2025, 24,750.7040.40
Units per Rs 10,000 at NSE Nifty 50 month end closes divided by 100 (NSE bhavcopy index data). Price index, no costs or taxes.
What would you do?
It is 28 Feb 2025. The Nifty 50 has closed at 22,124.70, 8.6 percent below its 31 Oct 2024 close, and your SIP is four months old.
- Pause until it settles
By 30 Jun 2025 the index was at 25,517.05, 15.3 percent above the February close. Instalments restarted then bought 39.19 units per Rs 10,000.
- Keep the SIP running
The February instalment bought 45.20 units per Rs 10,000, the most of any month in that stretch, and every later month added to them.
NSE, Nifty 50 month end closes: 24,205.35 (31 Oct 2024), 22,124.70 (28 Feb 2025), 25,517.05 (30 Jun 2025). Units at close divided by 100.
The one rule sitting underneath both stories
Two opposite lessons out of one piece of math. That bothered me until I found the sentence that ties them together.
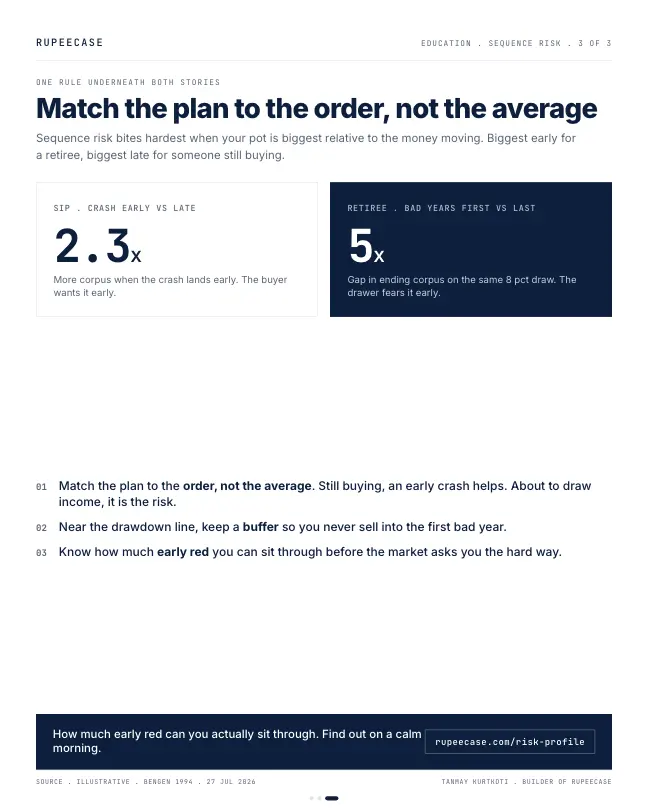
Sequence risk bites hardest when your portfolio is biggest relative to the money flowing in or out.
For a retiree the portfolio is biggest on day one and shrinks from there, so the early years carry all the risk. For someone accumulating the portfolio is biggest at the very end, so the late years are the dangerous ones and the early crash is almost free. Same principle read from opposite ends of the timeline. Whether an early crash is your gift or your ruin comes down to one question. Which way is your money moving.
Where this breaks, and who should not listen to me
Let me argue the other side, because the clean version oversells it.
I used an eight percent withdrawal to make the retiree chart shout. Draw a gentle four percent instead, the rate Bengen actually defended, and the gap narrows hard, roughly 122 against 178 on that same hundred. Still two different endings out of one average, just not five times apart. Nudge it to five or six percent and you land in between, near 99 against 169, then 75 against 159, always two numbers where the average promised you one. How big the effect gets depends entirely on how much you are pulling relative to the pot.
I also reshuffled one fixed set of returns rather than modelling real, messy markets with inflation, taxes, and a retiree who trims spending in a bad year. Real life has levers a spreadsheet does not. And Bengen's numbers came out of US history, which is not a promise about India's next thirty years. I cannot tell you which decade will hand you the bad years. Nobody can. That is the whole point, and it is exactly why this is a risk and not a strategy.
What the clean version gets right survives all of that. Averages are silent on order, and order stops being a footnote the moment money is moving.
Three things I keep coming back to
Match the plan to the shape, not to the average. If you are years away from needing the money and still buying, an early crash is on your side and the move is to keep buying through it. If you are about to start drawing an income, the first few years are the fragile ones and they deserve a buffer.
Near the drawdown line, guard the sequence. A cash cushion, or a shallower drawdown sleeve so you are not forced to sell into the first bad year, is worth more than one extra percent of headline return. The shallower drawdown strategies exist for exactly this reader.
Know your own tolerance before the market tests it. How much early red you can sit through without cancelling the SIP is a fact about you, not about the chart, and it is far better learned on a calm morning than a red one. That is the entire reason I built the risk profile.
The market will hand you the same ten years it hands everyone else. What it will never tell you in advance is the order. Build the plan that survives the bad ones showing up first.
Which way is your money moving today
One question decides how to read a fall: is money going in or coming out this year. The free Learn module on risk metrics that matter covers six risk metrics, drawdown among them, that describe the path rather than the average. The retirement side of the same arithmetic, with a full worked decade, is in same returns, different retirement.
Questions readers ask
What is sequence of returns risk?
It is the risk that the order of returns, not their average, decides the outcome once money is flowing in or out. With no cash flows the order does not matter at all, but with withdrawals a bad early stretch forces sales at low prices.
Should I stop my SIP when the market falls?
The arithmetic of an SIP points the other way: an instalment in a falling month buys more units. In the Feb 2025 low, Rs 10,000 bought 45.20 units at the Nifty 50 close divided by 100, against 39.19 units at the Jun 2025 close.
Why does sequence risk matter more near retirement?
Because the portfolio is at its largest relative to the money flowing out, and every unit sold in a bad early year is gone before the recovery. A cash buffer or a shallower drawdown portfolio in the first years reduces how many units have to be sold low.
The cards
3 cards. Swipe, or tap to open.
Explore next
Learn it properly, then see it applied.
- GuideHow long should you stay invested in equity? What every Nifty 50 holding period since 2012 showsEvery 1, 3, 5, 7 and 10 year window of the Nifty 50 since 2012: how often each one lost.
- StrategyAllcap strategyNifty Total Market, 50 stocks, every 2 weeks
- CalculatorCAGR calculatorFree, with the formula and a worked example
Related
- Same returns, different retirementThe same ten annual returns leave a Rs 1 crore corpus drawing Rs 6 lakh a year at Rs 125.66 lakh or Rs 39.08 lakh depending only on their order.Returns and risk maths . . 13 min
- The three year number that changes every dayEvery three year window on the Nifty 50 TRI from 2013 to 2025 ranged from 8.8 to 18.3 percent CAGR, and three months in 2020 moved it by 14 points.Returns and risk maths . . 10 min
- The volatility taxFive portfolios averaging 12 percent compound at 11.98 down to 4.00 percent depending only on volatility, so Rs 10 lakh over twenty years ends anywhere from Rs 96 lakh to Rs 22 lakh.Returns and risk maths . . 9 min
Educational content only. Figures are illustrative and computed on historical or representative data for teaching purposes, not investment advice. Past performance does not guarantee future returns. Sourced from NSE, BSE, SEBI, AMFI and RBI public data.