

Behaviour..6 min read
Overtrading and overconfidence
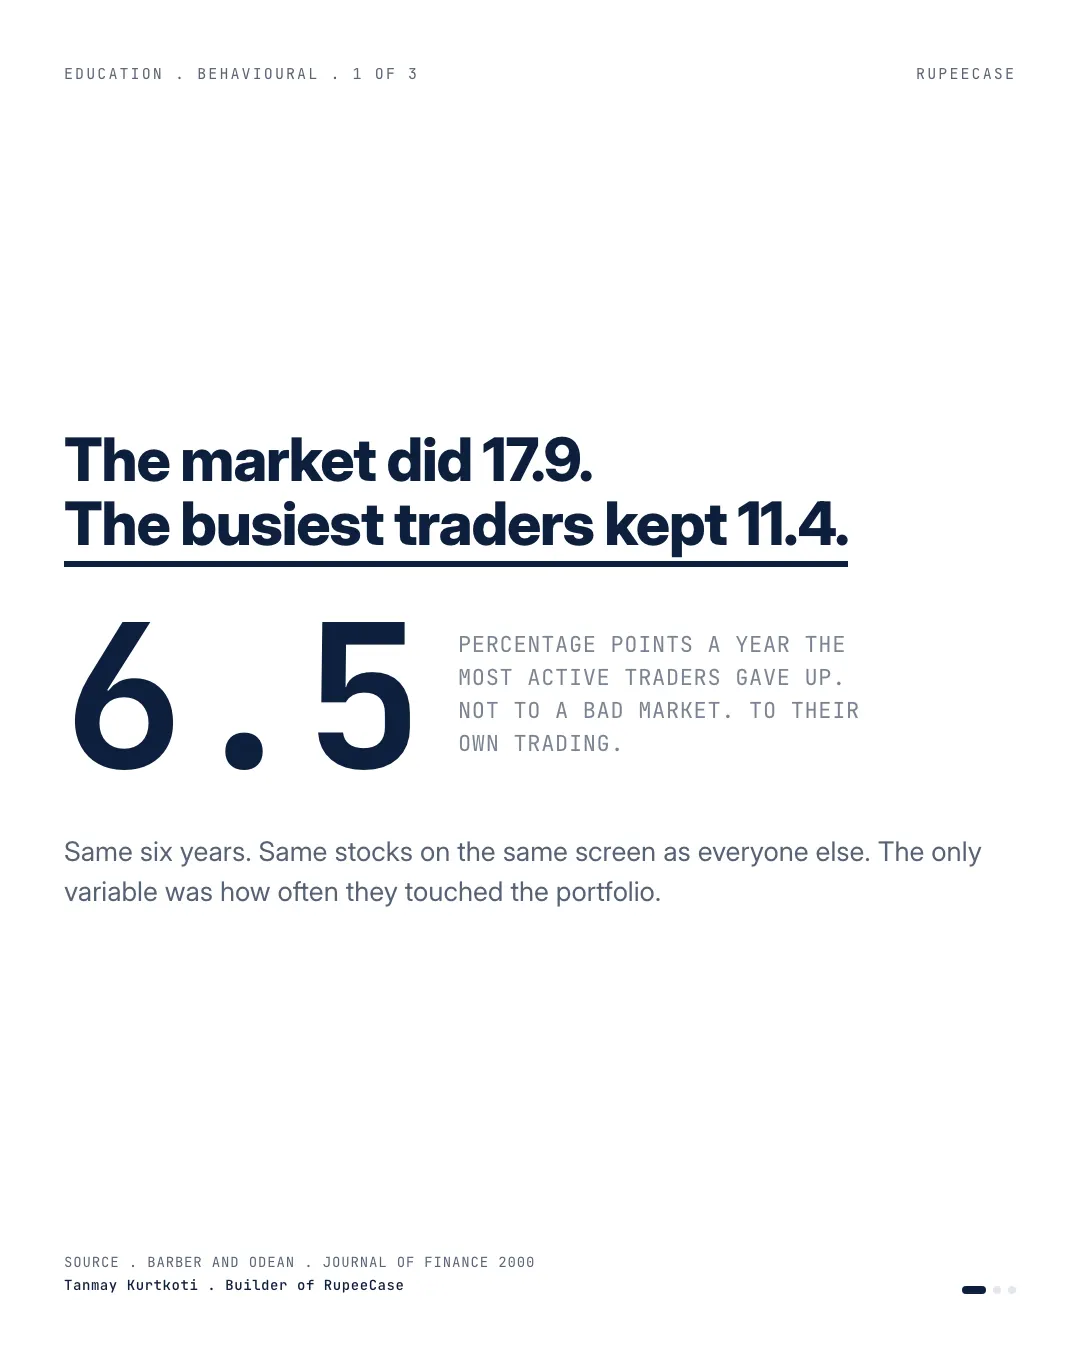
Barber and Odean's most active fifth of households earned 11.4 percent a year against a market at 17.9, and the trading itself was the cost.
By Tanmay Kurtkoti, founder of QC Alpha and builder of RupeeCase
A friend asked me over the weekend why his portfolio keeps lagging the index. He watches it like a hawk. Eleven times a day, reads every print, trades on most of them. He was sure all that attention had to be worth something.
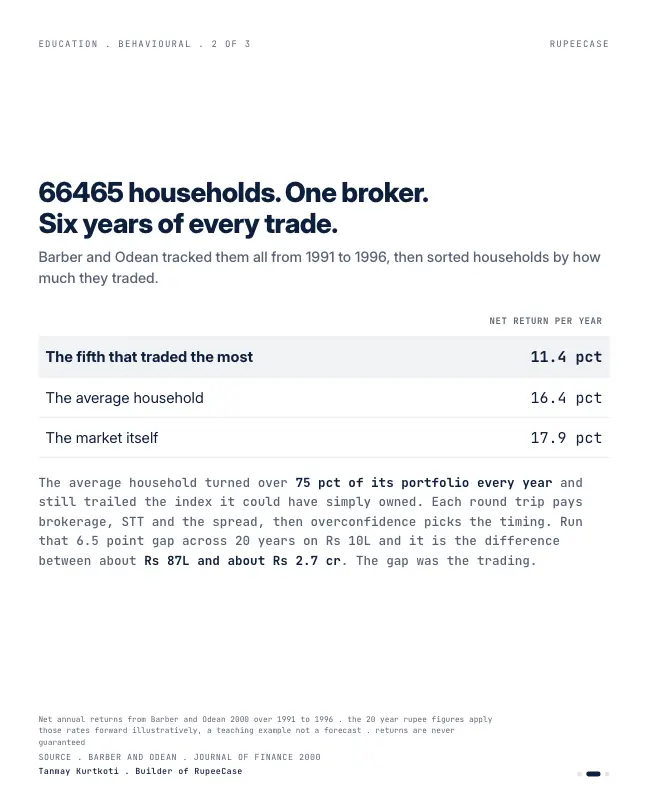
So I pulled the most famous study on the subject. Barber and Odean went through 66,465 households at a discount broker, every trade, 1991 to 1996. Then they sorted people by how much they traded.
The fifth that traded the most earned 11.4 percent a year. The market over the same stretch did 17.9. Same six years. Same stocks on the same screen. The only thing that separated them was how often they touched the portfolio.
The average household was not much better. It turned over 75 percent of its holdings every year and still finished behind the index it could have simply owned.
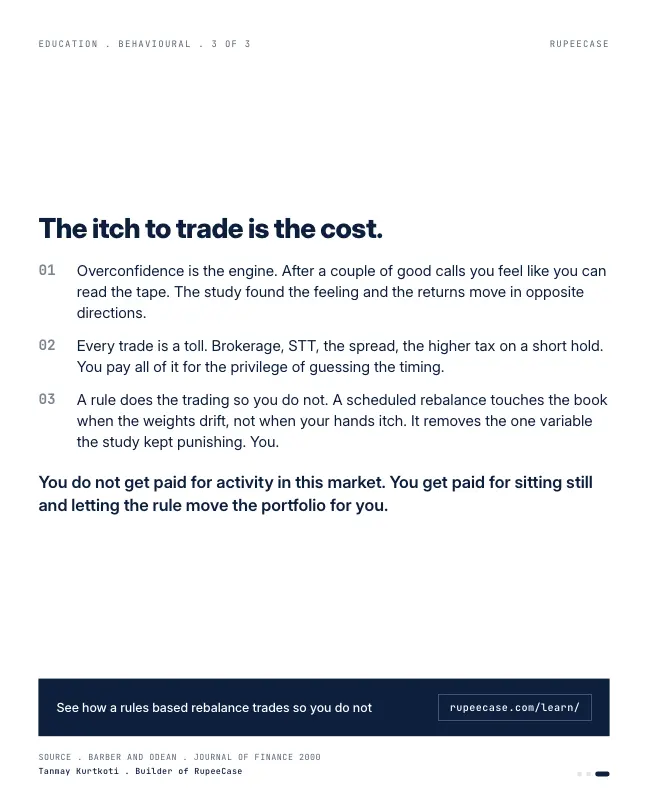
Here is the part nobody wants to hear. The trading itself is the cost. Every round trip pays brokerage, the securities transaction tax, the bid-ask spread, and then overconfidence steps in to pick the timing. Sell the winner, chase the noise. Run that 6.5 point yearly gap across twenty years on ten lakh and it is not a rounding error. It is most of the result.
The fix is boring, which is why it works. A rule that rebalances on a schedule trades when the weights drift, not when your hands itch. It removes the one variable the study kept punishing. You.
You do not get paid for activity in this market. You get paid for sitting still and letting the rule do the moving
The Indian version of the same study
Barber and Odean is American data from the 1990s. The fair question is whether it holds here, now. SEBI answered it twice, with the full books of the largest brokers.
The first was SEBI's study of intraday trading in the equity cash segment, published in July 2024. In FY23, 71 percent of individual intraday traders lost money after costs. Among those who made more than 500 trades in the year, it was 80 percent. The second is SEBI's study of individual traders in equity derivatives, published in August 2026: 87.7 percent of individuals lost money in FY26, down from 90.9 percent in FY25, and individuals paid about Rs 25,000 crore in transaction costs in each of those two years.
of individual intraday traders lost money in FY23
SEBI intraday study, Jul 2024
lost money among those with more than 500 trades a year
SEBI intraday study, Jul 2024
of individual F&O traders lost money in FY26
SEBI F&O study, Aug 2026
transaction costs paid by individual F&O traders in FY26
SEBI F&O study, Aug 2026
Different market, different decade, same shape. The people who touch the screen most are the ones most likely to be behind.
Costs grow faster than activity
The line in the intraday study that stayed with me is not the loss rate. It is what costs did to the people who were already losing. SEBI measured trading costs as a share of the trading loss itself. For loss makers with fewer than 10 trades a year, costs added 17 percent on top of the loss. For those above 500 trades, costs added 72 percent.
- Under 10 trades a year17%
- 10 to 50 trades26%
- 50 to 100 trades41%
- 100 to 500 trades57%
- More than 500 trades72%
Cost of trading as a percent of trading loss, loss makers, FY23. SEBI, Analysis of Intraday Trading by Individuals in Equity Cash Segment, Jul 2024, Table 11.
That is overconfidence with a receipt attached. Each trade feels like a small, sensible decision. The bill arrives as a sum.
One round trip, worked out in rupees
Take a delivery trade of Rs 1,00,000: you buy, and later you sell. Here is what leaves your account, using the rates in force in 2026.
- Securities transaction tax: 0.1 percent on the buy and 0.1 percent on the sell, so Rs 200.
- Stamp duty: 0.015 percent on the buy, so Rs 15.
- NSE transaction charge: Rs 3.07 per lakh on each side (rate from 1 Mar 2026), so Rs 6.14.
- SEBI turnover fee: Rs 10 per crore, so Rs 0.20.
- Brokerage: assume Rs 20 an order, so Rs 40. Your broker's rate may be lower or higher.
- GST at 18 percent on brokerage and exchange charges: about Rs 8.34.
That comes to about Rs 270, or 0.27 percent. Add the spread you cross on the way in and out. On a liquid stock, assume Rs 100 across both legs. Now one round trip costs about Rs 370, or 0.37 percent.
On its own, 0.37 percent looks harmless. What matters is how often you pay it. Turnover is the share of the portfolio you sell in a year. At 100 percent turnover you pay the round trip once on the whole portfolio. At 250 percent, two and a half times.
On Rs 10 lakh growing at an illustrative 12 percent a year for 20 years, costs alone do this:
- 25 percent turnover, roughly a once a year rebalance: about Rs 94.9 lakh.
- 75 percent, the Barber and Odean average: about Rs 91.8 lakh.
- 250 percent: about Rs 81.7 lakh.
- 500 percent: about Rs 69.1 lakh.
With no costs at all it would be about Rs 96.5 lakh. And this is only the friction. It assumes every trade was timed as well as doing nothing, which is the assumption the studies say is wrong.
The Learn module on overconfidence, anchoring and recency has a section on what it calls the screen time tax, and it is free with a quiz at the end. For the full cost stack, the trade cost calculator breaks a single order down line by line.
Why the confident trader does not see it
Overconfidence is not arrogance. It is the quiet belief that your read of today's move is better than the average read already in the price. Every single trade can be defended. The pattern only shows in a year of trades, and nobody keeps that ledger.
MythWatching the market closely and acting fast gives me an edge over people who check once a month.
FactIn SEBI's FY23 data, the share of loss makers rose with the number of trades, and costs grew from 17 to 72 percent of the trading loss.
I see the same trap in my own work at QC Alpha. A model that rebalances every week looks smarter on paper than one that rebalances every quarter, until you price the trades. What I want from a rule is the fewest trades that still keep the portfolio where it should be. If you want to see how one bad reaction compounds, read action bias next.
Questions readers ask
Does trading more often lower returns for Indian retail investors?
SEBI's July 2024 study of intraday traders found that 71 percent of individuals lost money in FY23, rising to 80 percent among those who made more than 500 trades in the year. Costs grew with activity too: for frequent traders they added 72 percent on top of the trading loss.
How much does one buy and sell of Rs 1 lakh cost in India?
For a delivery trade in 2026, statutory charges are about Rs 222: STT of Rs 200, stamp duty of Rs 15, NSE charges of about Rs 6 and a small SEBI fee. Brokerage, GST on it and the bid ask spread come on top, so Rs 300 to Rs 400 is a fair range for a liquid stock.
What is portfolio turnover?
Turnover is the value you sell in a year as a share of the portfolio. 100 percent means you replaced the whole portfolio once; 250 percent means two and a half times, and you pay a full round trip of costs each time.
The cards
3 cards. Swipe, or tap to open.
Explore next
Learn it properly, then see it applied.
- Free module 8.1Why Investors Lose, Introduction to Behavioural Finance11 min read
- StrategyAllcap strategyNifty Total Market, 50 stocks, every 2 weeks
- Free module 8.3Cognitive Biases: Overconfidence, Anchoring and Recency Bias10 min read
- CalculatorTrade cost calculatorFree, with the formula and a worked example
- Blog topicBehaviour notes27 notes
Related
- Risk tolerance is a moodGuiso, Sapienza and Zingales found risk aversion rose sharply after 2008 on fear rather than wealth, so ask the drawdown question in rupees, not percentages.Behaviour . . 5 min
- Doing nothing is the skillKeepers who stay in the centre save about a third of penalties and dive anyway; the investor who sold a 30 percent fall and bought back higher ended with 3,000 fewer units.Behaviour . . 5 min
- By the time the group agrees, the trade is finishedA momentum strategy's time weighted 16.7 percent CAGR became about minus 4.9 percent money weighted, because the crowd arrived the year after the 72 percent print.Behaviour . . 5 min
Educational content only. Figures are illustrative and computed on historical or representative data for teaching purposes, not investment advice. Past performance does not guarantee future returns. Sourced from NSE, BSE, SEBI, AMFI and RBI public data.