


Behaviour..5 min read
By the time the group agrees, the trade is finished
A momentum strategy's time weighted 16.7 percent CAGR became about minus 4.9 percent money weighted, because the crowd arrived the year after the 72 percent print.
By Tanmay Kurtkoti, founder of QC Alpha and builder of RupeeCase
Saturday morning. The family group chat lights up. Someone forwards a stock that has already doubled, with one line under the chart . "everyone is in this one."
Here is the part nobody in the group wants to hear. That line is not the signal the trade is safe. It is the signal the trade is late.
By the time a name is consensus, the marginal buyer who could push it higher has mostly already bought. The agreement did not create the upside. It used up the fuel.
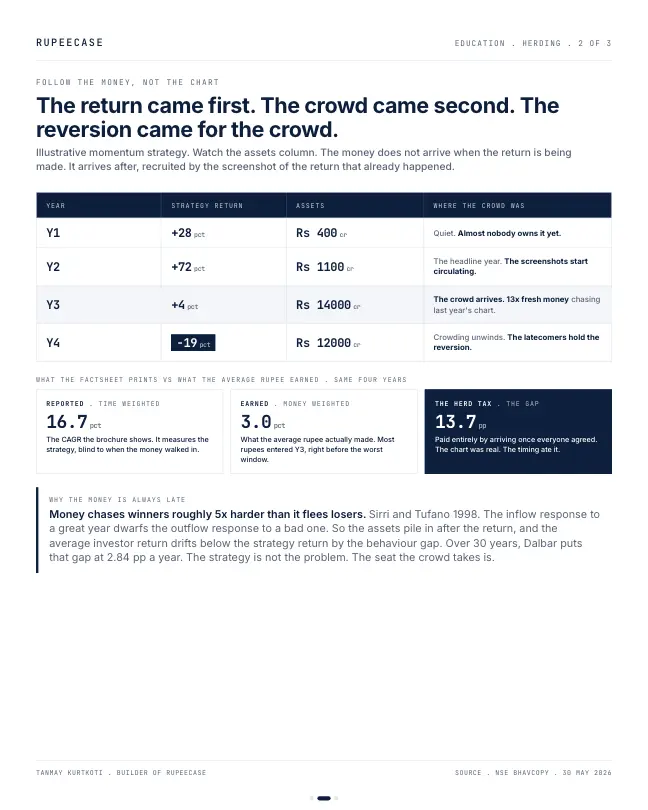
Watch where the money actually arrives, not where the chart already went. Take a hot momentum strategy. It prints a quiet +28 pct in year one on Rs 400 cr of assets. Then +72 pct in its headline year on Rs 1,100 cr. Then the screenshots start circulating, and in year three the assets balloon to Rs 14,000 cr . the crowd shows up the year after the return. Year four hands back 19 pct as the crowding unwinds.
The strategy's factsheet still prints a healthy time weighted number, about 16.7 pct CAGR across the four years. But the return the average rupee actually earned, money weighted, is about minus 4.9 pct a year on those flows, because the bulk of the money entered right before the worst window. A gap of more than 21 points. That gap is the herd tax, and almost nobody sees it because the brochure measures the strategy, not the timing of the people in it.
The asymmetry is structural. Money chases winners far harder than it flees losers (Sirri and Tufano, 1998). And a consensus is informationally thin . people copied the visible choice, not the underlying fact (Banerjee 1992, and Bikhchandani Hirshleifer and Welch on informational cascades, 1992). Copied conviction reverses fast on small new information.
By the time the group agrees, the trade is finished. The agreement did not make it safe. It used up the fuel
Two returns from the same four years
The gap in the opening comes from two honest ways of measuring a return. The time weighted return follows one rupee that went in on day one and never moved. It is what a factsheet prints, because it measures the strategy and ignores when money came and went. The money weighted return, the one an XIRR gives you, follows the actual rupees: when they arrived, how much, and what they were worth at the end.
For the four years to compound to 16.7 percent a year, the unstated third year has to be about plus 4 percent. Here are the four years as the factsheet sees them.
- Year 1, Rs 400 Cr in it28%
- Year 2, Rs 1,100 Cr in it72%
- Year 3, Rs 14,000 Cr in it4%
- Year 4, the unwind-19%
Worked example from the opening. Year 3 return implied by the 16.7% CAGR: 1.28 x 1.72 x 1.04 x 0.81 = 1.85 over four years.
Where the minus 4.9 comes from
Taking the opening's asset figures as the flows, Rs 400 crore at the start, about Rs 588 crore more at the start of year two to reach Rs 1,100 crore, and about Rs 12,108 crore more at the start of year three to reach Rs 14,000 crore, the money ends year four at about Rs 11,794 crore. Rs 13,096 crore went in. The internal rate of return on those flows is about minus 4.9 percent a year.
time weighted, the factsheet number
Worked example
money weighted, what the rupees earned
Worked example, IRR on the opening's flows
less than the money put in
Worked example
So on these flows the strategy compounded at 16.7 percent while the average rupee in it lost money. The exact figure depends on the year three assumption and on when in each year the money arrived, which the opening does not pin down. The direction does not change. When most of the money arrives after the best year, the money weighted return sits far below the factsheet.
Run it on one investor
The same thing happens to a single investor who follows the crowd. Put in a little at the start, a lot after the headline year, and see what the four years actually did for you.
Rs 1,10,000 in, about Rs 1,02,786 out, in a strategy whose factsheet says 16.7 percent a year. Nothing about the strategy was hidden. The investor's own timing produced the result. The XIRR calculator gives the money weighted return for any set of dated flows, including your own SIP and lump sum history.
How a cascade forms
The research in the opening describes why the late money is so large. Each person sees what the people before them did, not what they knew. After a few visible buyers, copying the crowd looks more sensible than trusting your own small piece of information, so you copy too, and the crowd grows without any new facts being added.
- A few people actA strong year prints. Early buyers have real reasons.
- Others copy the actionThe screenshot travels; the reasons do not.
- The crowd becomes the reason"Everyone is in this one" replaces any view on the business or the factor.
- Thin conviction reversesA small piece of bad news, and copied buyers leave together.
The defence is not to avoid popular strategies. It is to decide on size and timing by rule before the screenshot arrives, and to judge any strategy on its full history rather than the window everyone is sharing. The free Learn module on herd behaviour and market bubbles covers cascades and bubbles with Indian examples. The post on recency bias and factor crowding shows the same pattern in our own model back tests.
Questions readers ask
What is the difference between time weighted and money weighted return?
Time weighted return measures the strategy as if one rupee went in at the start and stayed, which is what a fund factsheet shows. Money weighted return, or XIRR, measures the rupees you actually put in and when, so it captures the effect of your own timing.
Why is my XIRR lower than the fund's return?
Usually because most of your money went in after a strong period and met a weaker one. In the worked example, a strategy compounded at 16.7 percent a year while an investor who added most money after the 72 percent year earned about minus 3.1 percent a year.
What is herd behaviour in the stock market?
It is investors copying what others are visibly doing instead of acting on their own information. It tends to bring the most money into a stock or strategy after its best run, which is why consensus often marks a late stage rather than a safe one.
The cards
3 cards. Swipe, or tap to open.

Explore next
Learn it properly, then see it applied.
- Free module 8.1Why Investors Lose, Introduction to Behavioural Finance11 min read
- StrategyAllcap strategyNifty Total Market, 50 stocks, every 2 weeks
- Free module 8.4Herd Behaviour and Market Bubbles8 min read
- CalculatorXIRR calculatorFree, with the formula and a worked example
- Blog topicBehaviour notes27 notes
Related
- Sunk cost: the first loss is the cheapestA 35 percent hole needs 54 percent to climb out, and a Rs 65,000 rump held flat for three years forgoes about Rs 30,000 against cutting and redeploying at the index.Behaviour . . 5 min
- Recency bias meets factor crowdingA model basket up 60 percent on a trailing return screen is a momentum tilt with a friendly name, and the same factor has lost 28, 21 and 19 percent in its three crashes.Behaviour . . 6 min
- Mental accounting: the bonus that feels differentThaler's mental accounting explains why a Diwali bonus gets spent and a salary SIP never misses, and a Rs 2 lakh splurge carries a thirty year bill of about Rs 60 lakh.Behaviour . . 5 min
Educational content only. Figures are illustrative and computed on historical or representative data for teaching purposes, not investment advice. Past performance does not guarantee future returns. Sourced from NSE, BSE, SEBI, AMFI and RBI public data.