

Behaviour..5 min read
Missing the best days
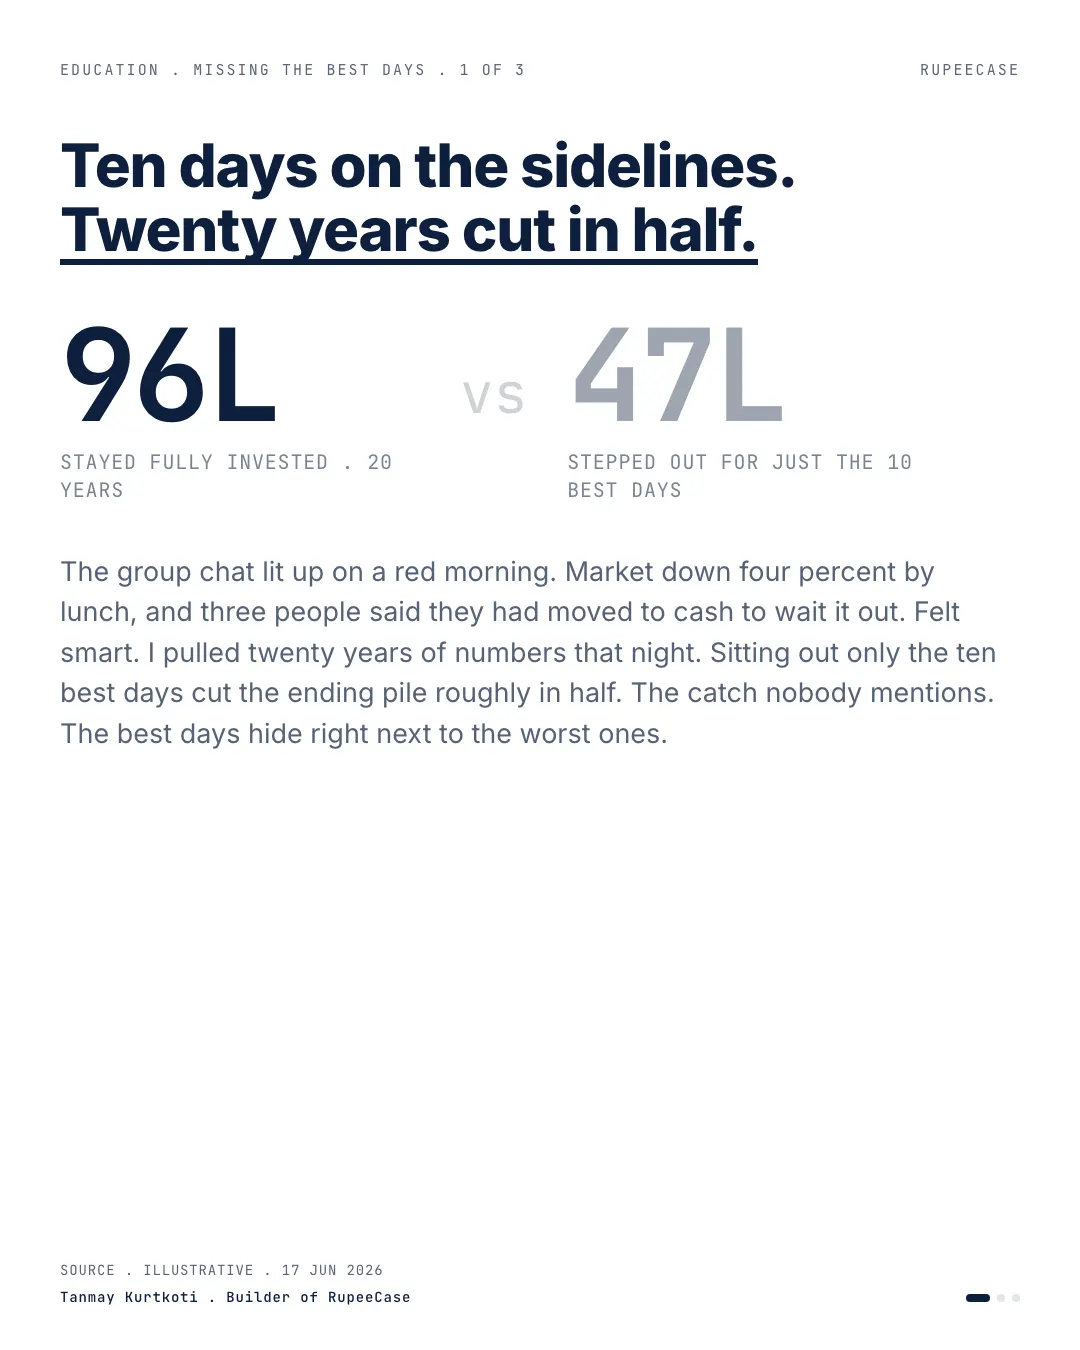
Sitting out the ten best days in twenty years cuts Rs 96 lakh to Rs 47 lakh on Rs 10 lakh at 12 percent, and those days cluster inside the worst weeks.
By Tanmay Kurtkoti, founder of QC Alpha and builder of RupeeCase
A red morning a few weeks ago. Market down about four percent by 10am, and the group chat was already moving. Three different people said the same thing. Moved to cash, will get back in once it settles. Sounded responsible. Felt smart.
I pulled twenty years of numbers that night.
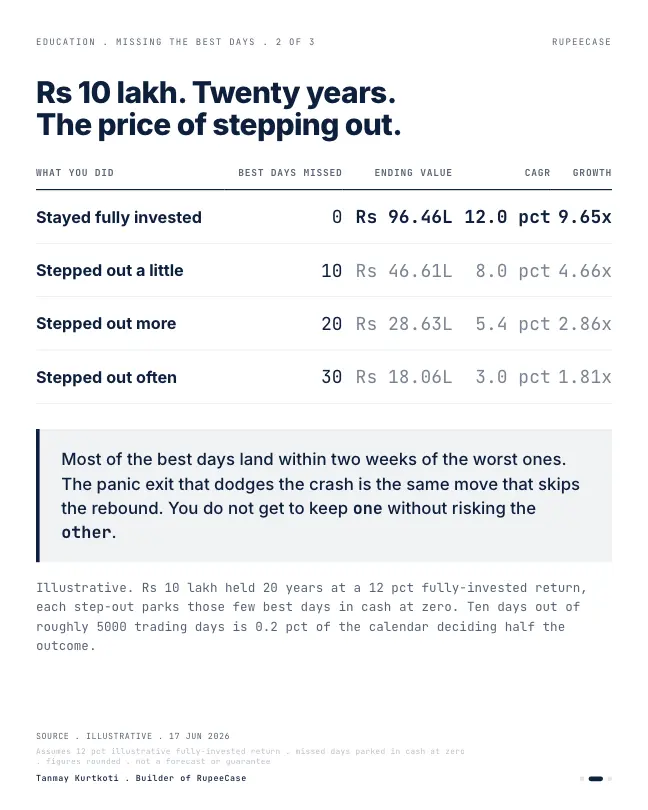
Take Rs 10 lakh, leave it fully invested for two decades at an illustrative twelve percent, and it grows to roughly Rs 96 lakh. Now sit out just the ten single best days across those twenty years, parking that money in cash on each one. You land closer to Rs 47 lakh. Half. Miss twenty of the best days and you are down near Rs 29 lakh. Thirty, and you are at Rs 18 lakh.
Ten days. Out of roughly five thousand trading days. Two tenths of one percent of the calendar deciding half the outcome.
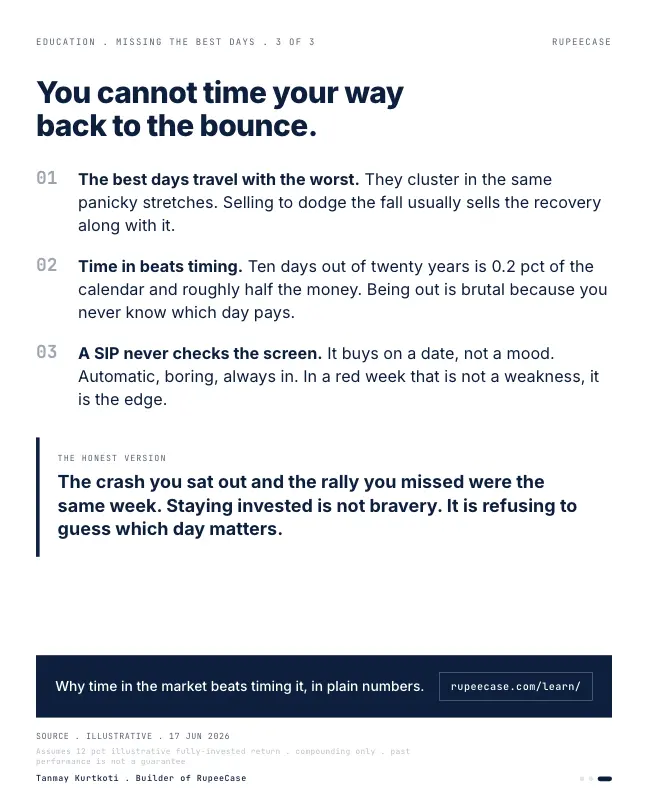
Here is the part the move-to-cash plan never accounts for. The best days do not stand politely apart from the worst ones. They cluster in the same panicky stretches, most of the biggest up-days landing within a couple of weeks of the biggest down-days. The exit that dodges the crash is usually the same exit that skips the snapback. You do not get to keep one and avoid the other.
Which is the quiet case for a SIP. It does not read the news. It does not feel the red. It buys on a date, not a mood, automatic and boring and always in. In a scary week that is not a weakness. That is the whole edge.
The crash you sat out and the rally you missed were the same week.
I ran it again on the last two years
Twenty years is a long, abstract window. So I ran the same test on something everyone reading this lived through: the Nifty 50 from 14 October 2024 to 9 October 2026, using NSE's daily closing data. That is 493 trading days, counting the two Budget day sessions. The index fell over the stretch, from 25,127.95 to 22,520.45, which makes it a harder test, not an easier one.
Put Rs 1,00,000 into the index at the first close and simply hold it, with no dividends and no costs, and it ends at Rs 89,623. Now take out the best and worst days one at a time, as if you had been in cash on exactly those sessions.
- Held all 493 daysRs 89,623
- Missed the best 5Rs 77,528
- Missed the best 10Rs 70,683
- Missed the worst 10Rs 1,13,317
- Missed best 10 and worst 10Rs 89,370
Rs 1,00,000 in the Nifty 50 price index, 14 Oct 2024 to 9 Oct 2026, cash earns nothing on missed days. Computed from NSE bhavcopy daily closes.
Look at the last two rows together. Dodging the ten worst days would have been worth a lot. But if your exits also cost you the ten best days, which is what usually happens, you end up at Rs 89,370, a little below someone who did nothing at all. You took every risk of trading and kept none of the reward.
Why the good days hide inside the bad weeks
It is not luck. Big up days need a big down day in front of them, and they happen when fear is highest, because that is when prices have room to snap back. In the two years of data, six of the ten best days came within six trading sessions of one of the ten worst. Here is March and April 2026, day by day.
- Nifty down 3.26%
The worst day in the two years.
- Down 2.60%
Two sessions later, another heavy fall.
- Up 1.78%
The very next day: one of the ten best.
- Down 2.14%
Month end close of 22,331.40, about 11% below February's.
- Up 3.78%
Five sessions after that close: the second best day in two years.
April 2025 told the same story: down 3.24 percent on 7 April, then up 1.92, 2.19 and 1.77 percent on 11, 15 and 17 April. Anyone who moved to cash after the first week and waited for calm missed most of the repair.
What would you do?
It is the close on 30 March 2026. The Nifty 50 is at 22,331.40, down about 11% in a month. The chat says move to cash.
- Sell now, buy back once it settles
Five sessions later the index had its second best day in two years, up 3.78% on 8 April. By 30 April it closed at 23,997.55, about 7.5% above your exit.
- Stay invested and let the SIP run
You sat through the fall and were there for the rebound: 7.5% from the 30 March close to the 30 April close.
Nifty 50 closes from NSE bhavcopy, 27 Feb, 30 Mar, 8 Apr and 30 Apr 2026. Past moves, not a forecast.
Do the long version on your own numbers
The opening used twenty years at an illustrative 12 percent. The arithmetic behind it is simple: every best day you miss divides your final value by one plus that day's gain. Change the inputs below to see how fast it adds up. The default best day gain is the average of the ten best Nifty 50 days in the two years above, 2.41 percent. Longer histories have bigger best days, so this is a mild version.
The free Learn module on why investors lose calls this the behaviour gap and walks through the biases that drive it, with a quiz and a certificate. To see what regular buying does with the same falls, try the SIP calculator, then read why pausing a SIP in a downturn is the most expensive instinct. For the 26 year version of this test, read the ten days that mattered.
Questions readers ask
What happens if you miss the best days in the stock market?
Each missed best day divides your final value by one plus that day's gain. On Nifty 50 data from October 2024 to October 2026, Rs 1,00,000 held throughout ended at Rs 89,623, but missing just the ten best days left Rs 70,683.
Why do the best market days come right after the worst ones?
Large rebounds need a large fall in front of them, and they tend to come when fear is highest. In the two years to October 2026, six of the Nifty 50's ten best days came within six trading sessions of one of its ten worst.
Is it better to move to cash during a market crash?
The data shows the cost of trying. Missing both the ten best and ten worst Nifty 50 days from October 2024 to October 2026 ended slightly below simply holding, because the exits that avoid the falls usually miss the rebounds too.
The cards
3 cards. Swipe, or tap to open.
Explore next
Learn it properly, then see it applied.
Related
- Pausing a SIP in a downturn is the most expensive instinctOn identical money and the same exit, the investor who kept buying through a 40 percent fall ended with 329 more units and Rs 39,471 more than the one who paused.Behaviour . . 5 min
- The behaviour gap: fund return vs investor returnIndian equity funds returned 19.1 percent a year from 2003 to 2022 while the rupees investors actually put in earned 13.8, and SIP investors earned 15.2.Behaviour . . 5 min
- Ten days that matteredRs 10 lakh in the Nifty 50 TRI from July 1999 grew to Rs 2.84 crore, or Rs 96 lakh without the 15 best days, seven of which sat within two weeks of the ten worst.Behaviour . . 10 min
Educational content only. Figures are illustrative and computed on historical or representative data for teaching purposes, not investment advice. Past performance does not guarantee future returns. Sourced from NSE, BSE, SEBI, AMFI and RBI public data.