

Company numbers..5 min read
Other income: you are buying the factory, not the FD
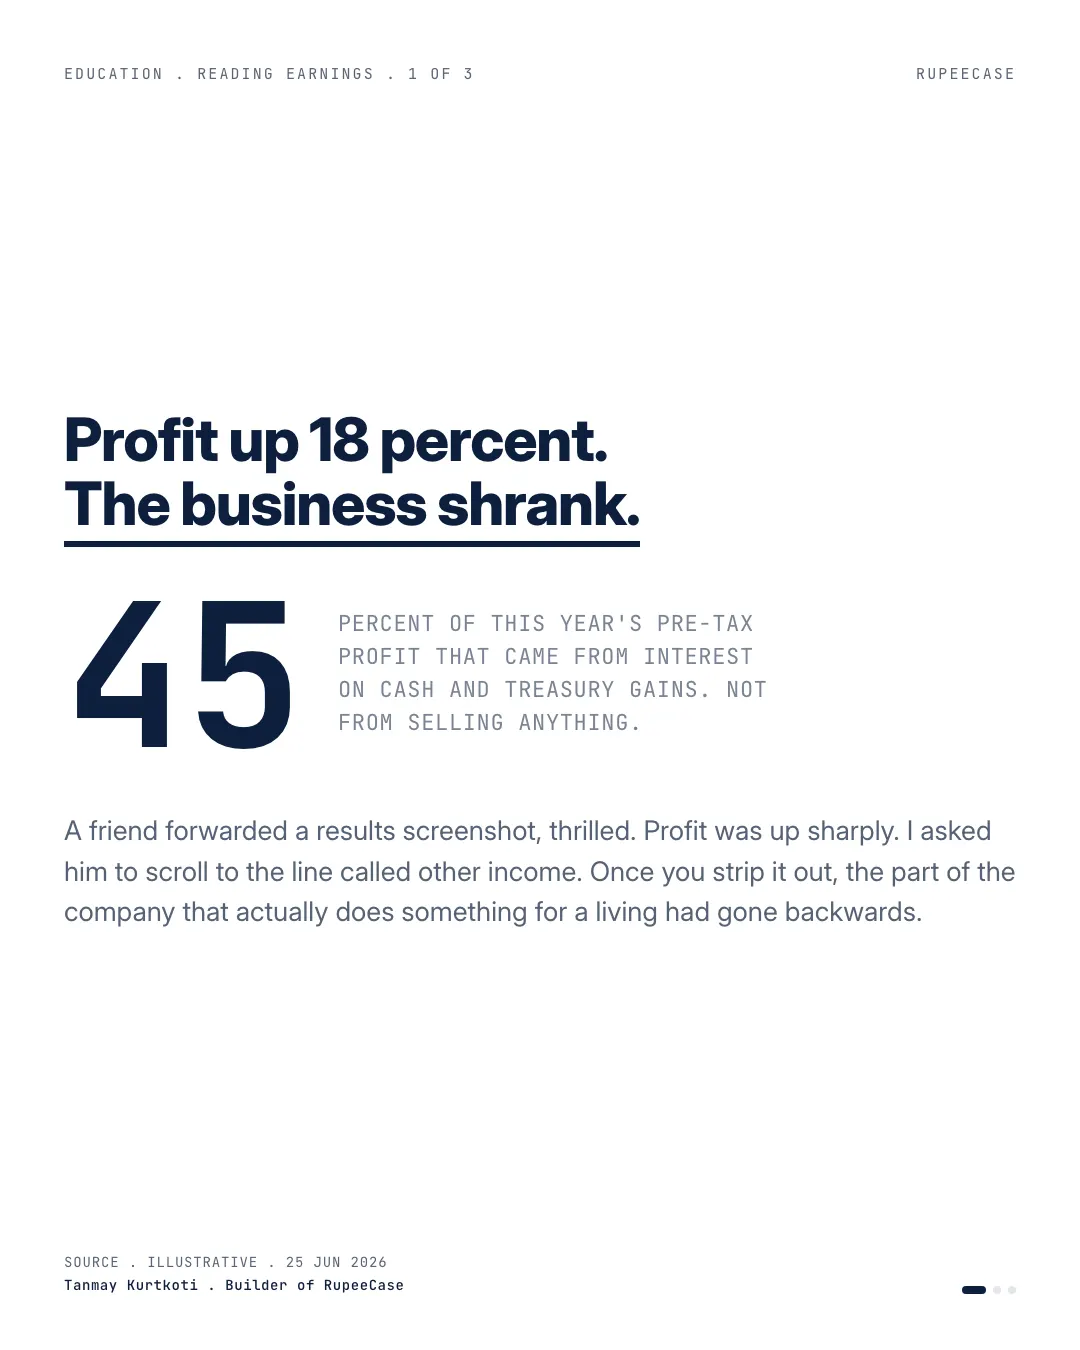
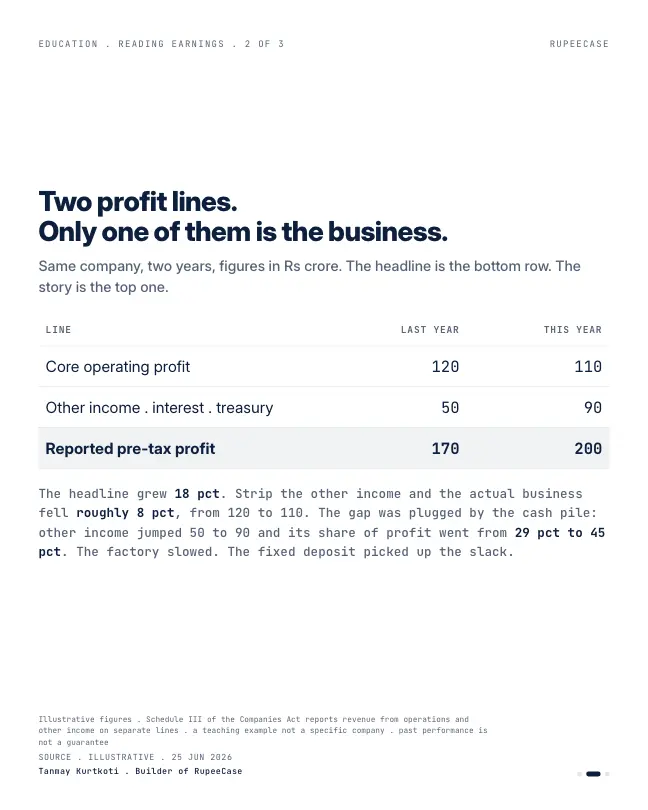
Reported profit rose from 170 to 200 while core business profit fell from 120 to 110, because other income's share of pre tax profit climbed from 29 to 45 percent.
By Tanmay Kurtkoti, founder of QC Alpha and builder of RupeeCase
A friend forwarded me a results screenshot last week, genuinely thrilled. Profit up 18 percent. Big green number. I asked him to do one thing before celebrating: scroll down to the line called other income.
Here is what that line does. A company's profit is not one number, it is two stories stacked on top of each other. There is the profit from the actual business, the part that makes and sells things. And there is other income: interest on cash sitting in the bank, dividends, gains from selling an asset or parking money in the market. Schedule III of the Companies Act keeps them on separate lines for exactly this reason.
So we split his screenshot. The core business profit had gone from 120 to 110. It shrank, roughly 8 percent. But other income had jumped from 50 to 90, and its share of pre-tax profit climbed from 29 percent to 45 percent. The reported number rose from 170 to 200 and looked like growth. Almost half of it came from the cash pile, not the product.
That is not fraud. It is not even unusual. Plenty of good companies sit on cash and earn interest on it. The problem is reading the bottom line as if every rupee in it came from the business getting better at its job.
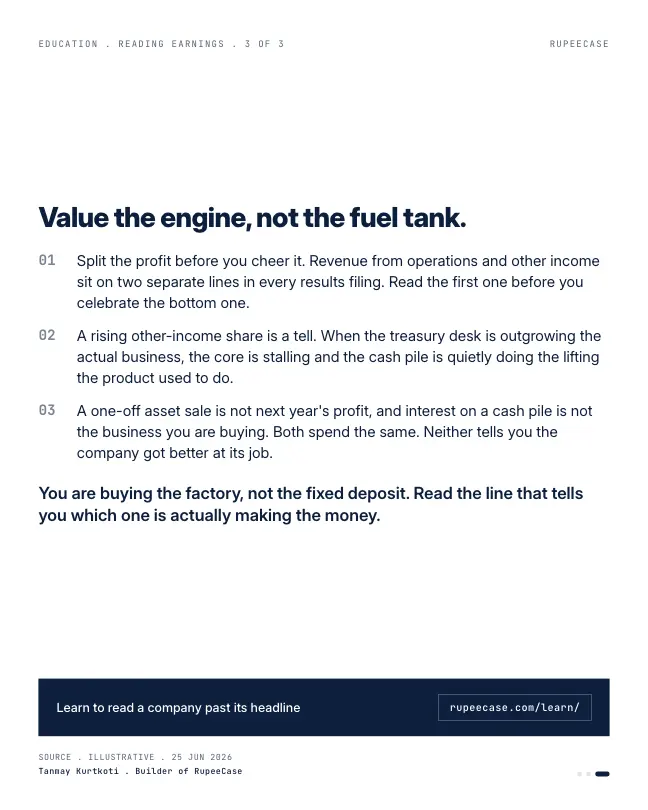
Two things I keep coming back to. A one-off asset sale is not next year's profit. And interest on a cash pile is not the business you are paying for. Both land in the same bank account. Only one of them tells you the company is improving.
You are buying the factory, not the fixed deposit. Read the line that tells you which one is actually making the money.
Two stories, stacked
Put the screenshot into rupees. Say the figures are Rs crore of profit before tax. Last year: Rs 120 crore from the business, Rs 50 crore of other income, Rs 170 crore in all. This year: Rs 110 crore from the business, Rs 90 crore of other income, Rs 200 crore in all. The total grew by 17.6 percent, which the headline rounds to 18. The part you are paying for fell by 8.3 percent.
Redo the split for any company with four numbers from two results filings. Profit before tax and other income, this year and last. Core profit is the first minus the second.
Not all other income is the same
The next step is to open the note behind the other income line. In this worked example, the Rs 90 crore has two parts. Rs 55 crore is interest on a cash and treasury pile of about Rs 750 crore. Rs 35 crore is a one time gain on selling an old warehouse. Last year's Rs 50 crore was all interest.
- Core business110
- Interest on cash55
- One time asset sale35
Profit before tax, Rs crore. Worked example, not a company.
The two parts deserve different treatment. The Rs 35 crore asset sale will not come back, so strip it completely before comparing years. Do that and the repeatable profit is Rs 110 crore plus Rs 55 crore, or Rs 165 crore, against Rs 170 crore last year. The 18 percent rise becomes a 2.9 percent fall.
The interest is repeatable, as long as the cash stays and rates hold. But it should not be valued the way the business is.
Why the market can overpay for a fixed deposit
Here is the part that costs money. Say the market prices this company at 25 times its profit after tax. At a 25 percent tax rate, the Rs 55 crore of interest becomes about Rs 41 crore after tax. Twenty five times Rs 41 crore is about Rs 1,031 crore of market value. The cash that earns that interest is about Rs 750 crore. On this arithmetic, the price includes roughly Rs 281 crore more for the cash pile than the cash itself is worth.
The cleaner way to read it is to price the two stories apart. Value the business on its core profit, then add the cash at what it is. That is the logic behind enterprise value. The free Learn module on revenue quality and earnings quality puts the other income check in its order of reads, with a quiz at the end.
The same habit runs through two other posts. Earnings quality in five lines starts with a land sale sitting inside other income, and the working capital cycle shows where the cash in a business actually goes.
Questions readers ask
What counts as other income in a company's results?
Other income is income that does not come from the company's main operations: interest on bank deposits and treasury investments, dividends received, gains on selling investments or assets, rent and similar items. It is shown on its own line, just below revenue from operations. The notes to the accounts break it down further.
How much other income is too much?
There is no fixed limit, but once other income is a quarter or more of profit before tax, headline growth can be driven by the treasury rather than the business. Check whether the share is rising year on year, and whether any part of it is a one time gain.
Is other income a concern for banks and finance companies?
The test works differently there. For banks and finance companies, interest is the core business and sits in revenue, while other income holds fees and treasury gains. The other income check in this post is built for manufacturing and service companies.
The cards
3 cards. Swipe, or tap to open.
Related
- The business that grows on its suppliers' moneyA 135 day cash conversion cycle needs Rs 37 crore to fund Rs 100 crore of extra sales, while a minus 35 day cycle is handed about Rs 10 crore for the same growth.Company numbers . . 5 min
- Five lines below the headlineA land sale, a deferred tax write back and a stretched depreciation life turned 3.8 percent profit growth into a 25 percent headline, and receivable days cracked first.Company numbers . . 5 min
- EPS grew, cash did notEarnings per share rising from 10 to 17 while free cash flow sits at 9 drops the conversion ratio from 0.90 to 0.53, and three quarters of that is a trend, not timing.Company numbers . . 5 min
Educational content only. Figures are illustrative and computed on historical or representative data for teaching purposes, not investment advice. Past performance does not guarantee future returns. Sourced from NSE, BSE, SEBI, AMFI and RBI public data.