

Company numbers..5 min read
EPS grew, cash did not
Earnings per share rising from 10 to 17 while free cash flow sits at 9 drops the conversion ratio from 0.90 to 0.53, and three quarters of that is a trend, not timing.
By Tanmay Kurtkoti, founder of QC Alpha and builder of RupeeCase
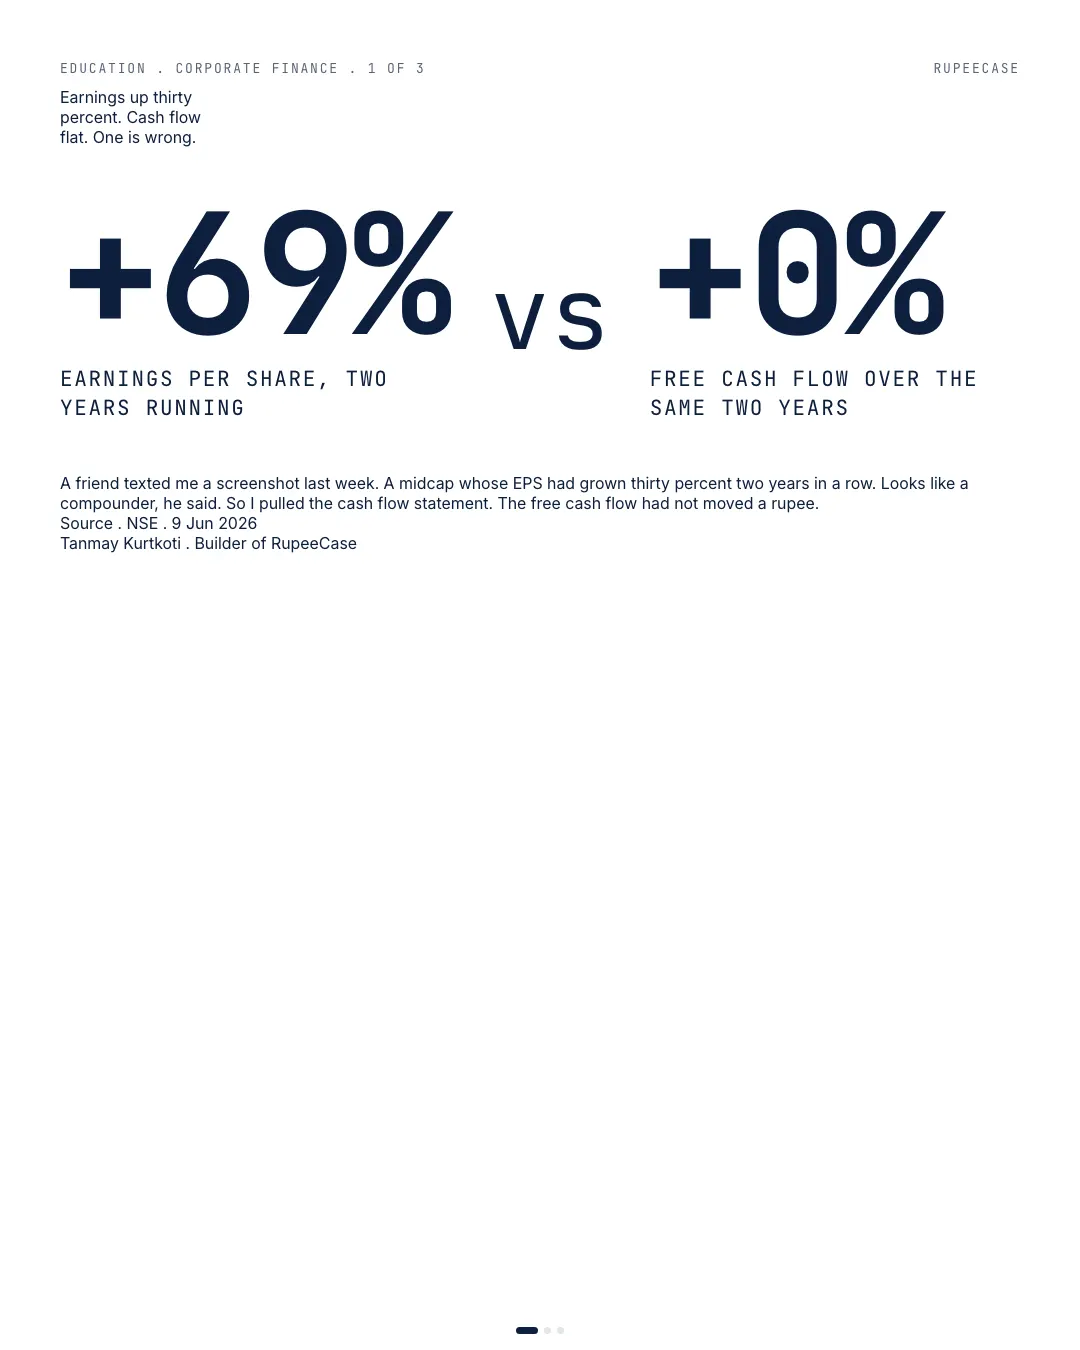
A friend texted me a screenshot last week. A midcap whose earnings per share had grown roughly thirty percent two years running. Looks like a compounder, he said. Why am I not in this.
So I pulled the cash flow statement. The free cash flow had not moved. Two years of earnings nearly doubling, and the actual cash the business threw off was flat.
Here is the part that trips people up. Earnings is not cash. A company can report a higher profit on the back of things that have not turned into money yet. A sale recognised in the quarter even though the customer pays next year. Inventory building up and sitting on the balance sheet as an asset. Costs that get capitalised, parked on the balance sheet and amortised slowly, instead of being run through the profit line now. Every one of those lifts reported earnings without a rupee changing hands.
The distance between profit and cash has a name. Accruals. Richard Sloan published the foundational work on it back in 1996, and the finding has been chewed over and confirmed many times since, including in the big earnings-quality survey by Dechow, Ge and Schrand in 2010. Companies where reported profit runs well ahead of cash tend to disappoint later. The cash was telling the truth first.
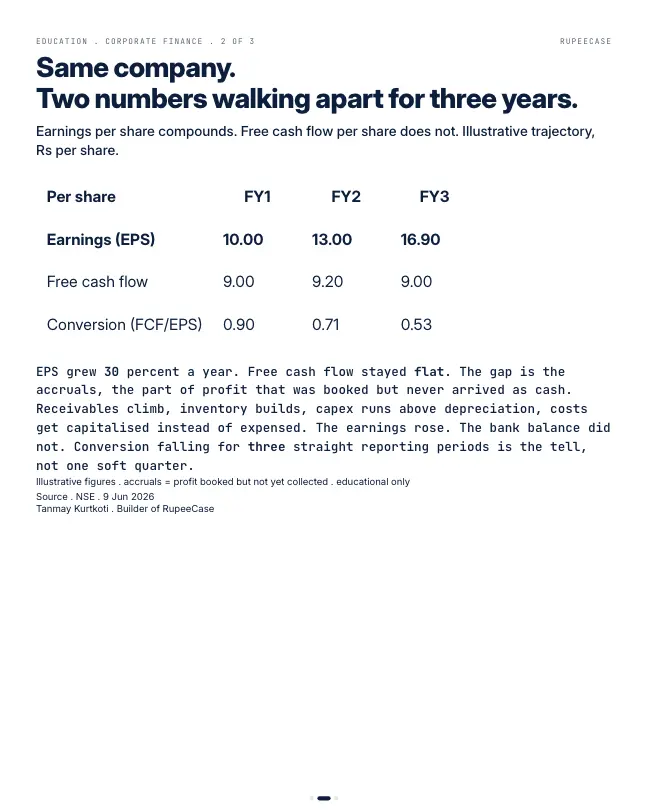
Run the illustrative version. Earnings per share goes from 10 to 13 to roughly 17 over three years. Free cash flow per share sits at 9, then 9, then 9. The conversion ratio, free cash flow divided by earnings, slides from 0.90 to 0.71 to 0.53. The headline says the business is compounding. The conversion ratio says recognition is running ahead of collection.
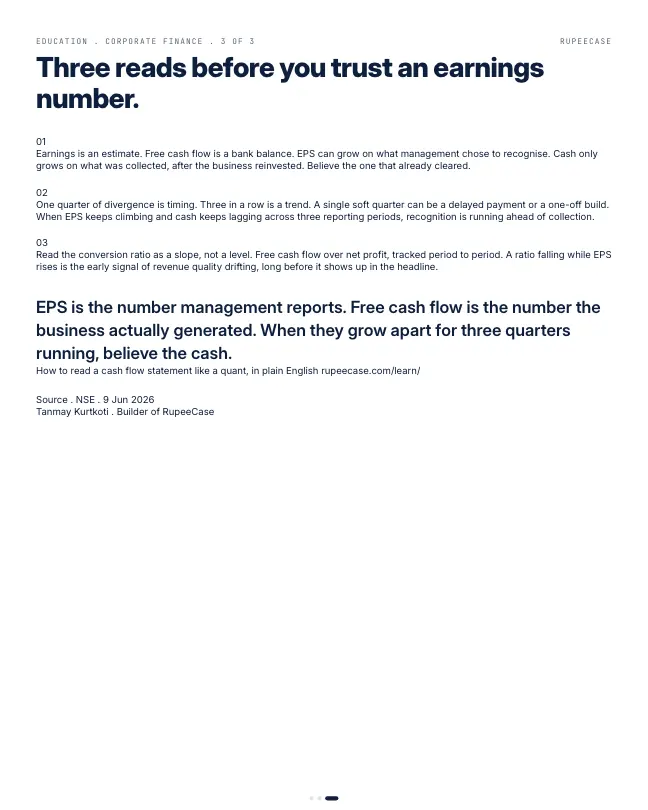
One quarter of this is timing. A delayed payment, a one-off build, nothing to see. Three quarters in a row is a trend, and that is the bar. The slope of the conversion ratio is the early warning, long before it reaches the headline number everyone watches.
Earnings is the number management reports. Free cash flow is the number the business actually generated. When they grow apart for three quarters running, believe the cash.
The slope is the signal
Put the opening's three years side by side. The second year's EPS is closer to 12.7 than 13, which is where the 0.71 comes from. Each year the business reports more profit per share and turns a smaller share of it into cash.
- Year 1: EPS 10, FCF 90.90
- Year 2: EPS 12.7, FCF 90.71
- Year 3: EPS 17, FCF 90.53
Free cash flow per share divided by EPS. Worked example from the opening, not a company.
Over the three years the company reported about Rs 39.7 of earnings per share and generated Rs 27 of free cash flow per share. With 10 crore shares, that is roughly Rs 127 crore of reported profit that has not shown up as cash. It is sitting somewhere on the balance sheet. The job is to find where.
Year three, from profit to free cash flow
Give the company 10 crore shares, so EPS of 17 is Rs 170 crore of net profit. Walk it down the cash flow statement.
Add back Rs 35 crore of depreciation and amortisation, which is a cost on paper and not cash this year. That is Rs 205 crore. Receivables rose Rs 45 crore: sales were booked, customers have not paid. Inventory rose Rs 30 crore. Cash from operations is Rs 130 crore. Then capital expenditure of Rs 40 crore, of which Rs 25 crore is development and project cost that was capitalised instead of expensed. Free cash flow is Rs 90 crore, or Rs 9 a share.
- Net profit170
- Add back depreciation+35
- Rise in receivables-45
- Rise in inventory-30
- Capex, incl. capitalised cost-40
- Free cash flow90
Rs crore, year three. Simplified: tax, payables and other items left out. Worked example, not a company.
The capitalised Rs 25 crore matters twice. Had it been expensed, net profit would have been lower by that amount less tax, and EPS would have grown less. Instead it sits on the balance sheet and runs through the profit line slowly, as amortisation, over the next several years.
Three places the missing cash hides
A falling conversion ratio is a question, not a verdict. A growing business invests, and some years capex is high because a plant is being built. What separates honest growth from aggressive recognition is where the gap sits and whether it keeps widening.
- Receivable daysTrade receivables divided by sales, times 365. Rising faster than sales means credit is being extended to book revenue.
- Inventory daysInventory divided by cost of goods, times 365. A steady climb means goods are being made faster than they sell.
- Capitalised costsCapital work in progress and intangible assets under development. If these grow every year and never finish, costs are being parked.
Read the three over the same three years as the conversion ratio. If one of them explains most of the gap and is moving the wrong way, you know what to watch next quarter. The free Learn module on revenue quality and earnings quality walks through each of these with a calculator and a quiz. The post on cash against profit runs the same bridge for one quarter, and the one on earnings quality in five lines turns it into a short checklist.
MythIf EPS grows 30 percent a year, the cash available to shareholders grows 30 percent a year.
FactIn the worked example EPS rose from 10 to 17 while free cash flow per share stayed at 9. Dividends, buybacks and debt repayment are paid from cash, not from EPS.
Questions readers ask
What is the difference between EPS and free cash flow per share?
EPS is net profit divided by shares, and it includes sales not yet collected and costs moved to the balance sheet. Free cash flow per share is cash from operations less capital expenditure, divided by shares. Over many years the two should track each other; a widening gap means profit is being recognised faster than cash arrives.
What is a good free cash flow conversion ratio?
For a mature business, free cash flow close to net profit, a ratio near 0.8 to 1.0 over several years, is a common healthy range. Fast growing or capital heavy companies can run lower for a while. The trend matters more than one year: a ratio that falls three periods in a row deserves a closer look.
Where do I find free cash flow for an Indian company?
It is not printed as one line. Take net cash from operating activities and subtract purchase of property, plant and equipment and intangibles, both from the cash flow statement in the annual report or the half yearly results filed on NSE and BSE.
The cards
3 cards. Swipe, or tap to open.
Reading path
Stop 3 of 8 on Reading a company
Related
- Five lines below the headlineA land sale, a deferred tax write back and a stretched depreciation life turned 3.8 percent profit growth into a 25 percent headline, and receivable days cracked first.Company numbers . . 5 min
- The business that grows on its suppliers' moneyA 135 day cash conversion cycle needs Rs 37 crore to fund Rs 100 crore of extra sales, while a minus 35 day cycle is handed about Rs 10 crore for the same growth.Company numbers . . 5 min
- Other income: you are buying the factory, not the FDReported profit rose from 170 to 200 while core business profit fell from 120 to 110, because other income's share of pre tax profit climbed from 29 to 45 percent.Company numbers . . 5 min
Educational content only. Figures are illustrative and computed on historical or representative data for teaching purposes, not investment advice. Past performance does not guarantee future returns. Sourced from NSE, BSE, SEBI, AMFI and RBI public data.