

Company numbers..5 min read
The business that grows on its suppliers' money
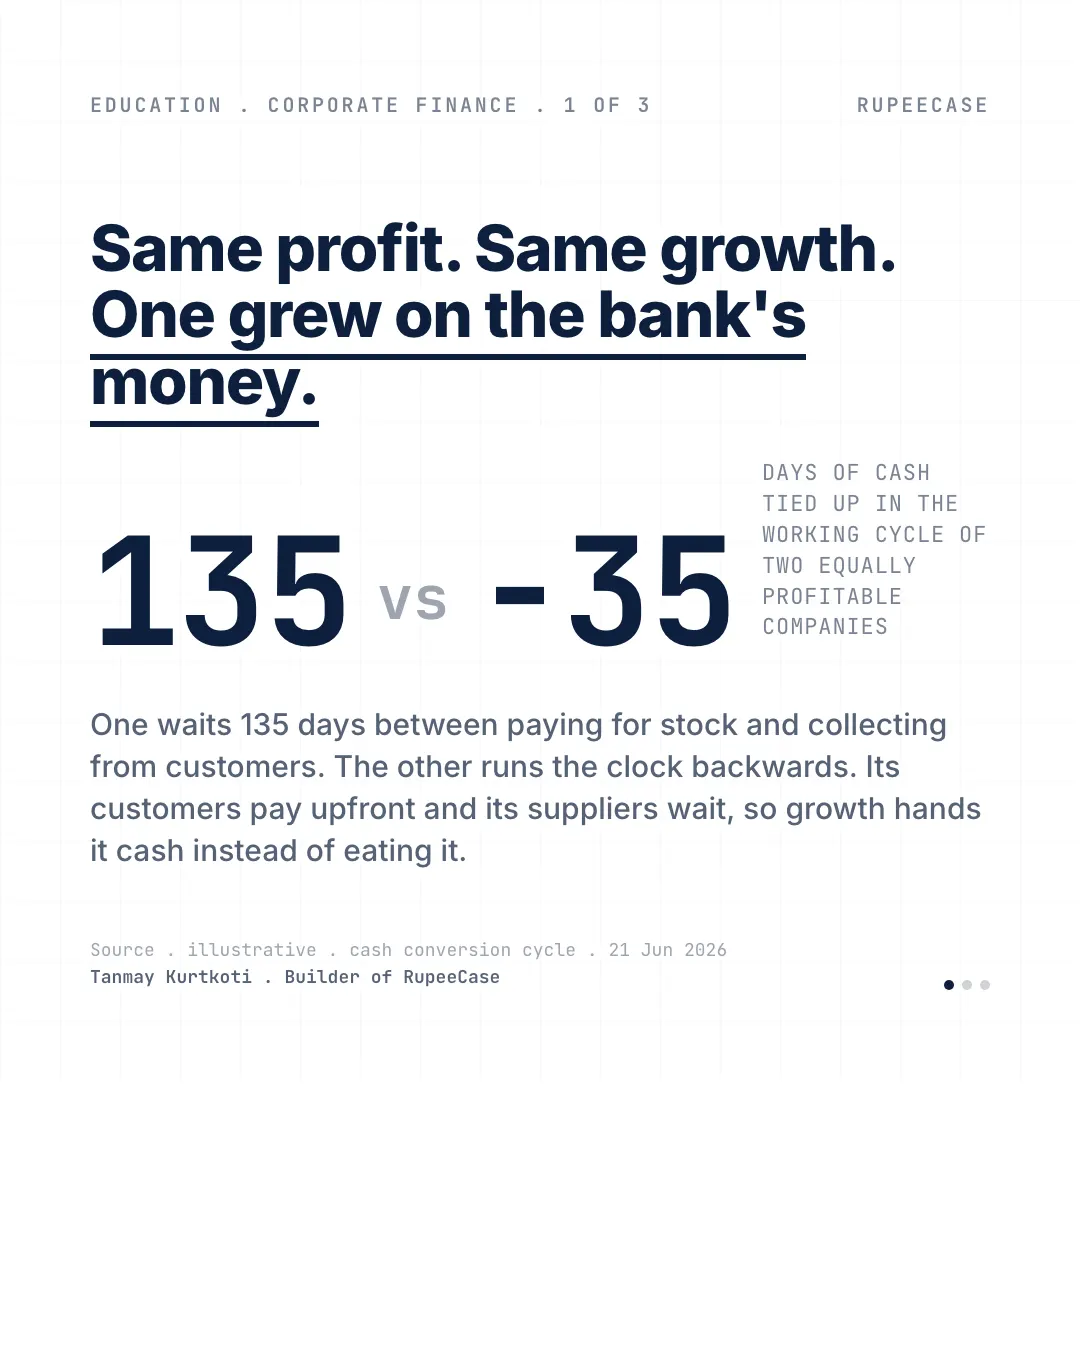
A 135 day cash conversion cycle needs Rs 37 crore to fund Rs 100 crore of extra sales, while a minus 35 day cycle is handed about Rs 10 crore for the same growth.
By Tanmay Kurtkoti, founder of QC Alpha and builder of RupeeCase
Two companies crossed my desk last week with almost identical income statements. Same revenue, same margin, both growing nicely. One of them spent the whole year scrambling for cash and topping up a working capital loan. The other generated more and more cash the faster it grew. Same profit on paper, two completely different lives. The difference was not in the profit line at all.
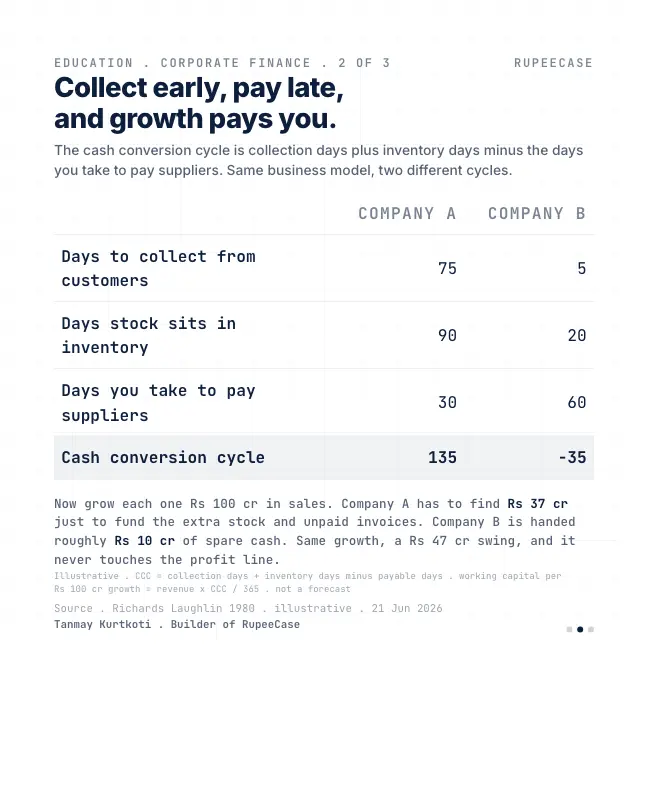
It was in the cash conversion cycle. Take the days a company waits to collect from customers, add the days its stock sits in inventory, subtract the days it takes to pay its own suppliers. That number is how long the company's cash is locked up before it comes back.
Company A collects in 75 days, holds inventory for 90, and pays suppliers in 30. That is 135 days of its own money tied up in every cycle. Company B is the mirror image. Customers pay it upfront in 5 days, stock moves in 20, and it takes 60 days to pay suppliers. Its cycle is minus 35 days. The suppliers and the customers are funding the business for it.
Here is where it bites. Grow each one by Rs 100 crore of sales. Company A has to find Rs 37 crore just to fund the extra inventory and the invoices customers have not paid yet. Company B is handed roughly Rs 10 crore of spare cash for the same growth. A Rs 47 crore swing, and you will not find a hint of it on the profit line.
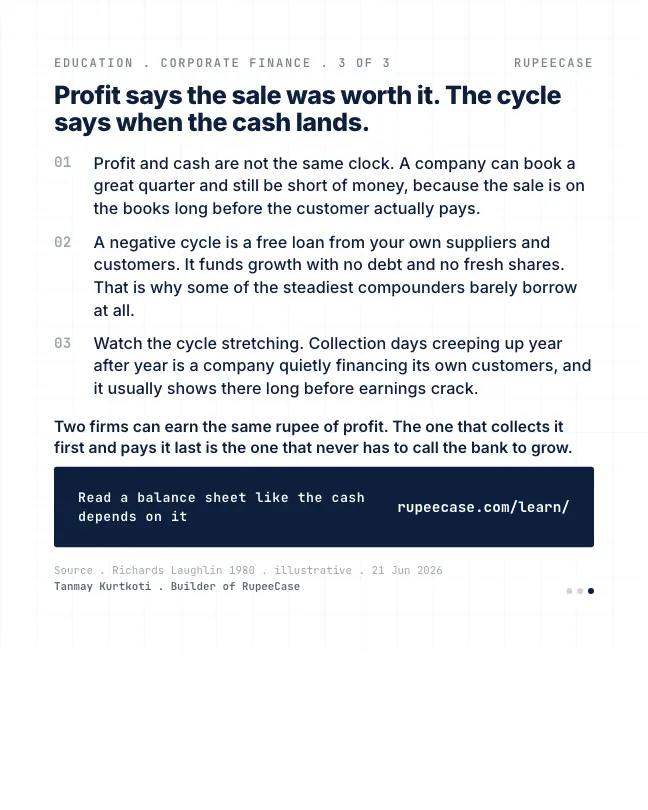
This is why some of the steadiest compounders barely borrow. A negative cycle is a free loan that scales with them. And it is why a quietly rising collection-days number, year after year, is worth more of your attention than one good quarter. The one that collects first and pays last rarely has to call the bank to grow
Where the Rs 37 crore goes
Break the cycle into its three parts and put rupees on each. For every Rs 100 crore of extra sales, a business needs its days divided by 365 times Rs 100 crore in each bucket. (Strictly, inventory and payables are measured against cost of goods, not sales. Using sales for all three keeps the sum simple and close enough to see the shape.)
Company A: receivables of 75 days tie up Rs 20.5 crore. Inventory of 90 days ties up Rs 24.7 crore. Suppliers waiting 30 days give back Rs 8.2 crore. Net, Rs 37.0 crore. Company B: Rs 1.4 crore in receivables, Rs 5.5 crore in inventory, and Rs 16.4 crore of supplier credit. Net, the business releases Rs 9.6 crore.
- A, receivable days75
- A, inventory days90
- A, payable days-30
- B, receivable days5
- B, inventory days20
- B, payable days-60
Days. Cycle = receivable days plus inventory days minus payable days: 135 for A, minus 35 for B. Worked example, not a company.
Five years of growth, two bank balances
One year of growth is a small number. Compounded growth turns it into the whole story. Give both companies Rs 1,000 crore of sales today, 20 percent growth a year for five years, and an 8 percent net margin.
Sales reach about Rs 2,488 crore. Across the five years they add Rs 1,488 crore of new sales and earn about Rs 714 crore of net profit. Company A has to put about Rs 550 crore of that into receivables and inventory, leaving Rs 164 crore. Company B gets about Rs 143 crore of extra cash from its cycle on top of its profit, for Rs 857 crore. Same income statement for five years. One has five times the cash of the other.
- Five year net profit, both714
- A, locked in working capital-550
- A, cash left164
- B, released by its cycle+143
- B, cash available857
Rs crore over five years, 20 percent sales growth a year from Rs 1,000 crore, 8 percent net margin, cycle held constant. Worked example, not a company.
If Company A also wants to pay a dividend or build a plant, the Rs 550 crore has to come from a loan or new shares. At 10 percent interest, a Rs 550 crore working capital line costs Rs 55 crore a year, and that cost does land on the profit line, a few years after the cause.
Reading the three numbers from an annual report
- Receivable daysTrade receivables on the balance sheet, divided by revenue from operations, times 365.
- Inventory daysInventories divided by cost of materials consumed plus purchases, times 365.
- Payable daysTrade payables divided by the same cost line, times 365.
- Track five yearsThe level depends on the industry. The direction is what tells you something has changed.
The first number to drift is usually receivable days. A company pushing sales into distributors at the end of a year, or selling to weaker customers on longer credit, shows it here before anywhere else. The free Learn module on reading financial statements shows where each of these lines sits in an Indian annual report, and the post on EPS against free cash flow follows the same cash into the cash flow statement.
MythA fast growing, profitable company will always generate more cash as it grows.
FactWith a 135 day cycle, every Rs 100 crore of new sales needs Rs 37 crore of cash before a rupee comes back. Growth can drain cash even while profit rises.
Questions readers ask
How do you calculate the cash conversion cycle?
Add receivable days and inventory days, then subtract payable days. Receivable days are trade receivables over revenue times 365; inventory and payable days use the cost of goods. A result of 135 days means the company's own cash is tied up for about four and a half months in every cycle.
What does a negative cash conversion cycle mean?
It means the company collects from customers before it pays its suppliers, so suppliers fund its working capital. Such a business releases cash as it grows: in the worked example, Rs 100 crore of extra sales frees about Rs 10 crore.
Why does a rising receivable days number matter?
It means customers are taking longer to pay, or sales are being booked on easier credit. Profit looks the same, but more cash is stuck with customers, and some of it may never be collected. A steady rise over several years is an early sign of weaker earnings quality.
The cards
3 cards. Swipe, or tap to open.
Explore next
Learn it properly, then see it applied.
Related
- Other income: you are buying the factory, not the FDReported profit rose from 170 to 200 while core business profit fell from 120 to 110, because other income's share of pre tax profit climbed from 29 to 45 percent.Company numbers . . 5 min
- Five lines below the headlineA land sale, a deferred tax write back and a stretched depreciation life turned 3.8 percent profit growth into a 25 percent headline, and receivable days cracked first.Company numbers . . 5 min
- EPS grew, cash did notEarnings per share rising from 10 to 17 while free cash flow sits at 9 drops the conversion ratio from 0.90 to 0.53, and three quarters of that is a trend, not timing.Company numbers . . 5 min
Educational content only. Figures are illustrative and computed on historical or representative data for teaching purposes, not investment advice. Past performance does not guarantee future returns. Sourced from NSE, BSE, SEBI, AMFI and RBI public data.