

Portfolio construction..5 min read
The diversification cliff
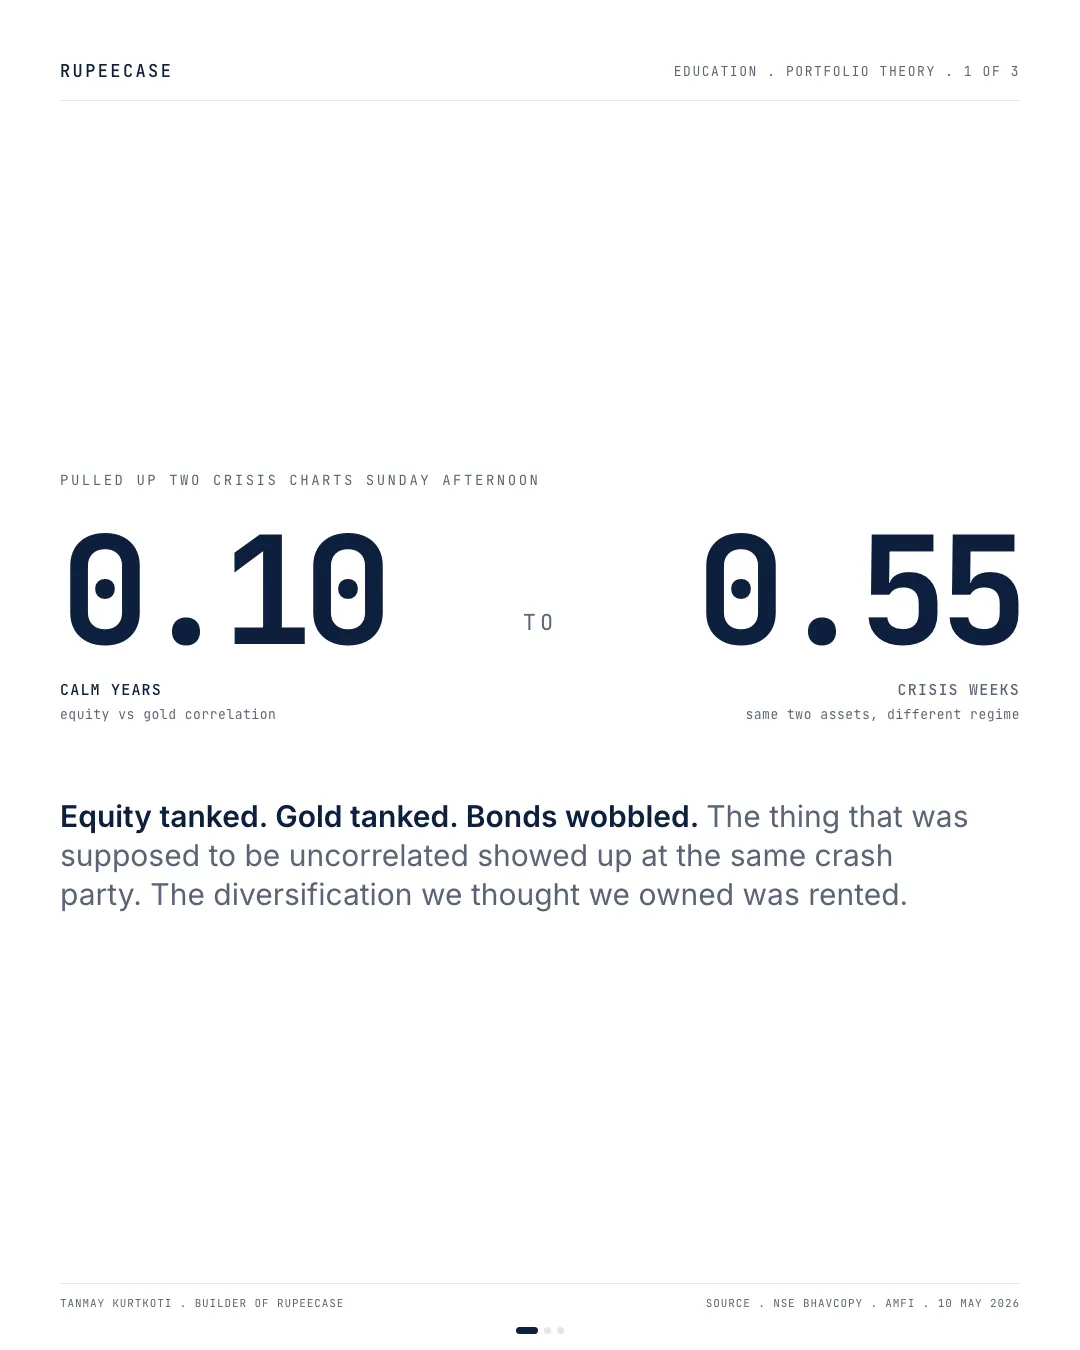
In March 2008 and March 2020 the textbook diversifiers fell together, because correlation is conditional and jumps from 0.10 to 0.55 for equity and gold in a liquidity crunch.
By Tanmay Kurtkoti, founder of QC Alpha and builder of RupeeCase
Sunday afternoon I pulled up two crisis charts side by side. March 2008. March 2020. Two of the worst weeks in living market memory.
Then I overlaid what the textbook diversifiers did during those weeks. Equity. Gold. Investment grade bonds. REITs. Emerging markets. The kind of mix that a five year backtest tells you is "well diversified."
Equity tanked. Gold tanked. Bonds wobbled, then sold off briefly in March 2020 as the cash dash dragged them in. EM dropped harder than developed markets. The thing that was supposed to save you showed up at the same crash party.
The diversification I thought I owned was rented.
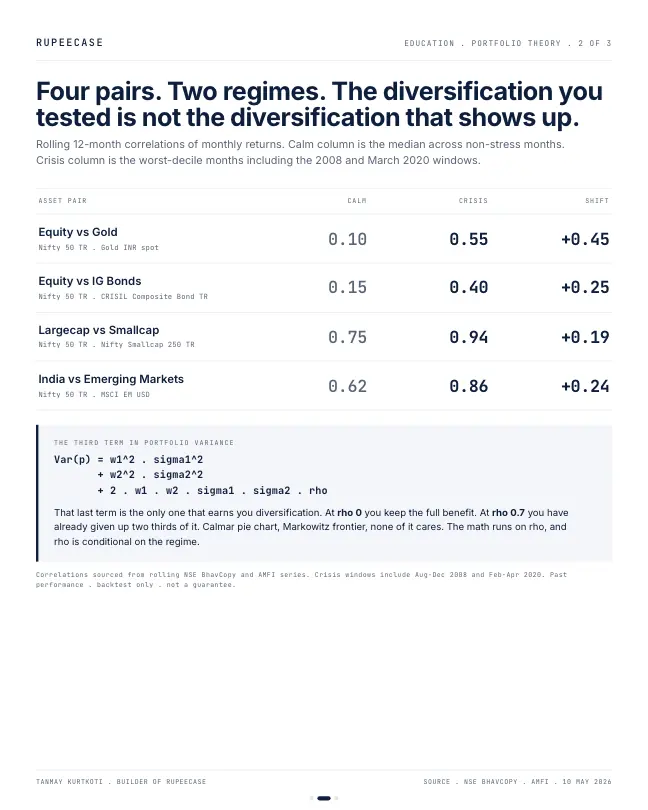
The math behind it is not even hidden. It is the third term in the portfolio variance equation:
2 . w1 . w2 . sigma1 . sigma2 . rho
Rho is the correlation. At rho 0 you get the full diversification benefit. At rho 0.7 you have already given up two thirds of it. And the dirty secret of every asset class table you have ever seen is that correlations are not constants. They are conditional. In normal years equity and gold run at rho 0.10. In a real liquidity crunch the same pair jumps to 0.55. Largecap vs smallcap goes from 0.75 in calm regimes to 0.94 in a crash. Two names, one move.
Three rules I now run on any "diversified" book.
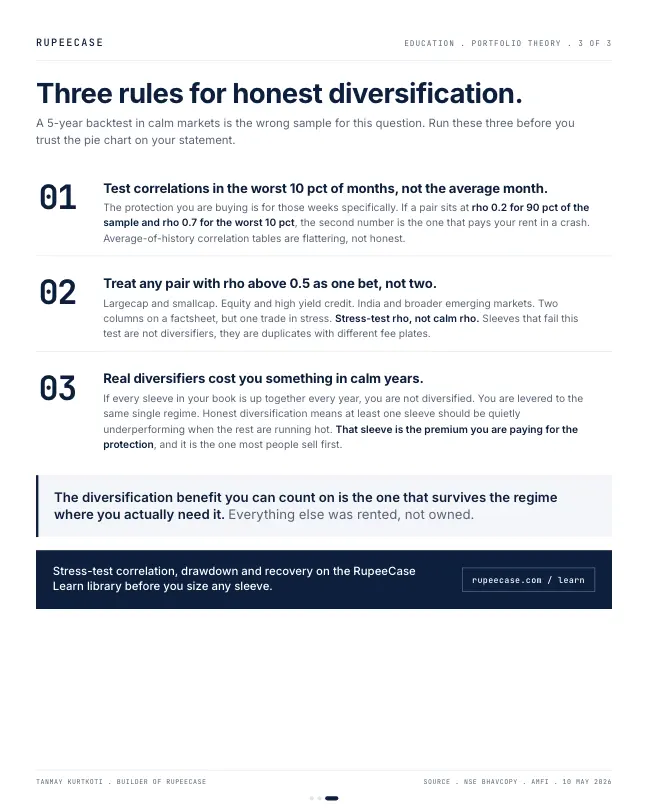
One. Test correlations in the worst 10 pct of months, not the average month. The protection you are buying is for those weeks specifically.
Two. Treat any pair with rho above 0.5 as one bet, not two. Two columns on a factsheet, one trade in stress.
Three. Real diversifiers cost you something in calm years. If everything is up together, you are not diversified. You are levered to the same single regime.
The diversification benefit you can count on is the one that survives the regime where you actually need it
What the cross term is worth in rupees
The formula reads abstract until you put a correlation into it and watch the portfolio's swing change. Take a 70/30 book: 70 percent equity at about 18 percent volatility, 30 percent gold at about 15. The three terms of the variance are 0.49 x 18 squared, 0.09 x 15 squared, and the cross term.
At a correlation of 0.10 the variance is 158.8 + 20.3 + 11.3 = 190.4, and the book swings about 13.8 percent a year. Push the correlation to 0.55 and the cross term grows to 62.4. The book now swings about 15.5 percent. Same assets, same weights, a calmer book in calm years and a louder one in a crunch.
At a correlation of 1 there is no benefit at all: the portfolio swing is just the weighted average, 17.1 percent. Every point of correlation below 1 is what you are actually buying when you add a second asset. In a crunch, part of that purchase is taken back.
A recent Indian quarter, on NSE data
You do not need 2008 to see this. The quarter from 31 Dec 2025 to 30 Mar 2026 was a sharp one for Indian equity. The Nifty 50 closed at 26,129.60 at the start and 22,331.40 at the end, a fall of 14.5 percent. Over the same quarter the Nifty Composite G-sec Index, the broad government bond index, also fell, by 1.4 percent. The one quarter where the bond sleeve was most needed, it did not rise.
| Index | Dec 24 | Mar 25 | Jun 25 | Sep 25 | Dec 25 | Mar 26 | Jun 26 | Sep 26 |
|---|---|---|---|---|---|---|---|---|
| Nifty 50 | -5.9 | -0.5 | 8.5 | -3.6 | 6.2 | -14.5 | 6.9 | -5.2 |
| G-sec | 1.2 | 3.0 | 2.4 | 0.0 | 1.2 | -1.4 | 4.3 | -1.2 |
Quarter returns from NSE closes, Nifty 50 (price) and Nifty Composite G-sec Index, quarters ending Dec 2024 to Sep 2026; the first quarter starts 14 Oct 2024. RupeeCase calculation from NSE bhavcopy index history.
Read the table across. In the three worst equity quarters (Dec 2024, Mar 2026 and Sep 2026), the G-sec index fell in two of them. In the good equity quarters it was mostly up. That is not a reason to drop bonds: a 1.4 percent fall next to a 14.5 percent fall still cushions a lot. It is a reason to stop treating the cushion as a guaranteed opposite move.
Gold told a different story over a different year. An NSE listed gold ETF rose about 26.9 percent between 30 Sep 2025 and 30 Sep 2026 while the Nifty 50 fell about 8.1 percent, and its monthly returns had a correlation of about 0.20 with the index. Low correlation over one year is a good sign. It is still one year.
Testing a book for the bad weeks
- Pick the bad monthsSort your history by the equity return and keep the worst tenth of months or quarters.
- Measure only thoseCheck what each diversifier did in exactly those periods, not on average.
- Merge the twinsAny pair that fell together in most bad periods is one bet. Size it as one.
- Accept the calm year costA real diversifier often lags in good years. That lag is the premium for the bad ones.
The free Learn module on risk management covers stress tests, drawdown limits and correlation in a crisis, with Indian examples and a quiz. The Sharpe and volatility calculator lets you check any mix's risk from its parts. For the calmer side of the same maths, read why adding gold can improve an all equity book.
Questions readers ask
Why do all assets fall together in a crash?
In a liquidity crunch many investors sell whatever they can to raise cash, so prices of unrelated assets move together. Correlations that are low in calm periods rise sharply, which removes part of the diversification benefit exactly when it is needed.
Do government bonds always rise when stocks fall?
No. From 31 Dec 2025 to 30 Mar 2026 the Nifty 50 fell 14.5 percent and the Nifty Composite G-sec Index fell 1.4 percent. Bonds usually fall much less than stocks, which still cushions a portfolio, but the direction is not guaranteed.
How do I check if my portfolio is really diversified?
Look at what each holding did in the worst months for equity, not in an average month. Holdings that fell together in most of those months are one bet and should be sized as one.
The cards
3 cards. Swipe, or tap to open.
Related
- Why adding gold can improve an all equity bookA 20 percent gold sleeve at 0.15 correlation takes a 13/19 equity book to 12.0 percent return and 15.9 percent volatility, because the variance cross term shrinks.Portfolio construction . . 4 min
- Volatility is half the story, correlation decidesAdding 20 percent gold at 15 percent volatility to an 18 percent volatility equity book brings the blend down to 15.0, because gold rarely falls on equity's bad days.Portfolio construction . . 4 min
- Rebalancing harvests volatilityAn equal weight five fund SIP drifted to 38/17/16/15/14 in two years, and a two asset napkin shows how rebalancing at the swing turns a flat round trip into a 10 percent gain.Portfolio construction . . 6 min
Educational content only. Figures are illustrative and computed on historical or representative data for teaching purposes, not investment advice. Past performance does not guarantee future returns. Sourced from NSE, BSE, SEBI, AMFI and RBI public data.