

Portfolio construction..4 min read
Why adding gold can improve an all equity book
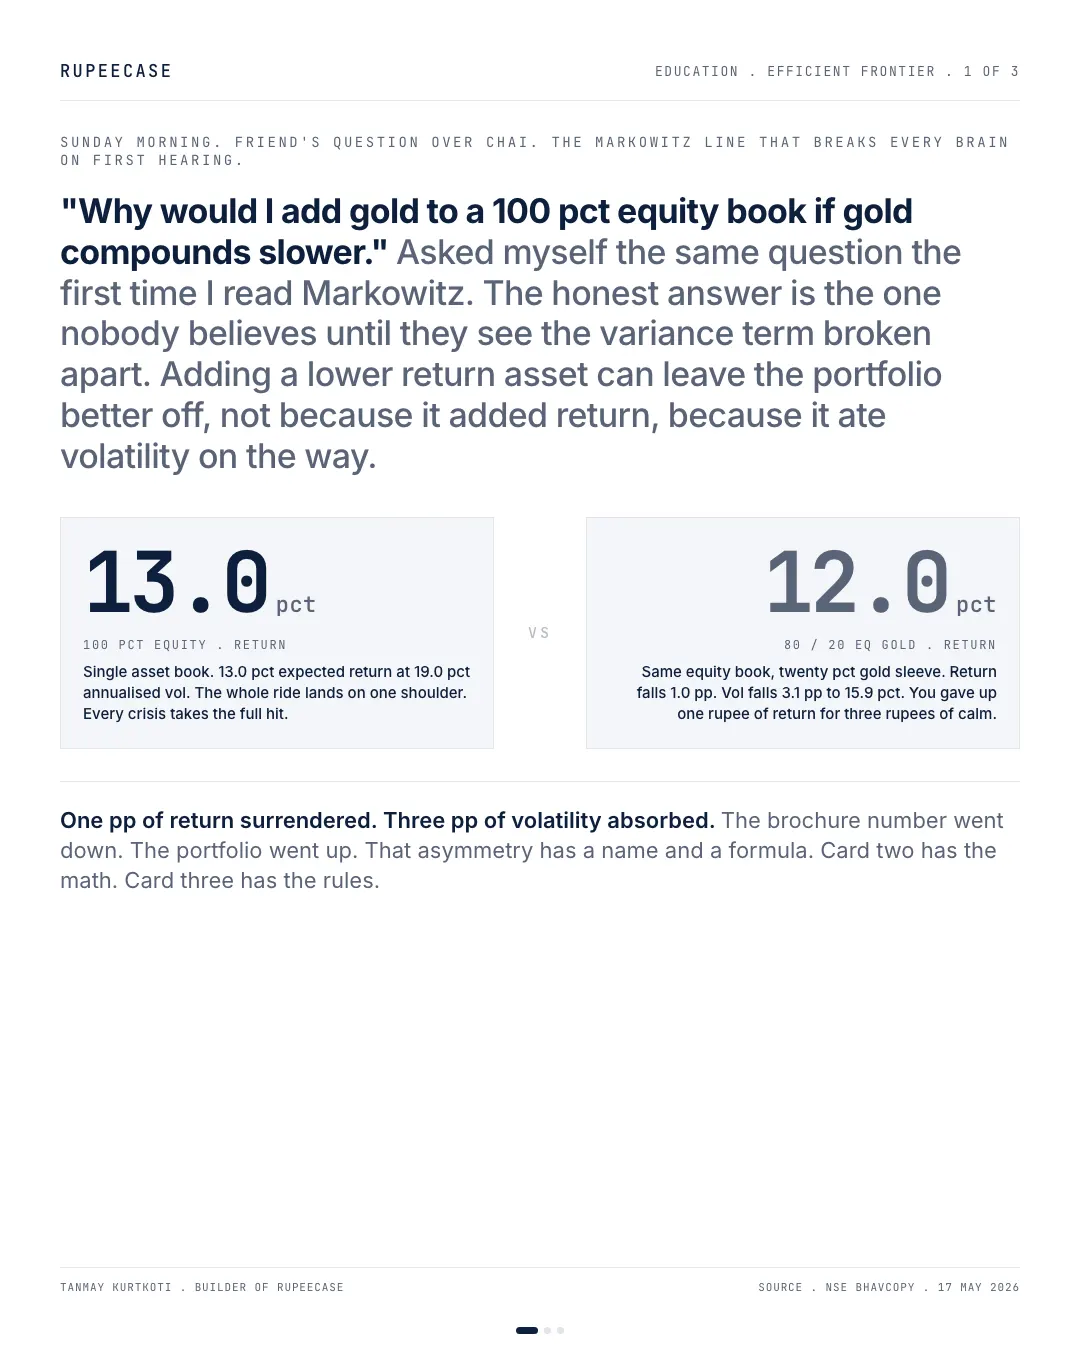
A 20 percent gold sleeve at 0.15 correlation takes a 13/19 equity book to 12.0 percent return and 15.9 percent volatility, because the variance cross term shrinks.
By Tanmay Kurtkoti, founder of QC Alpha and builder of RupeeCase
Sunday morning. Friend over chai. Says he is 100 pct equity. Asks why he would add gold to the book if gold compounds slower than equity.
Asked myself the same question the first time I read Markowitz. The honest answer is the one nobody believes until they see the math.
Adding a lower return asset can leave the portfolio better off.
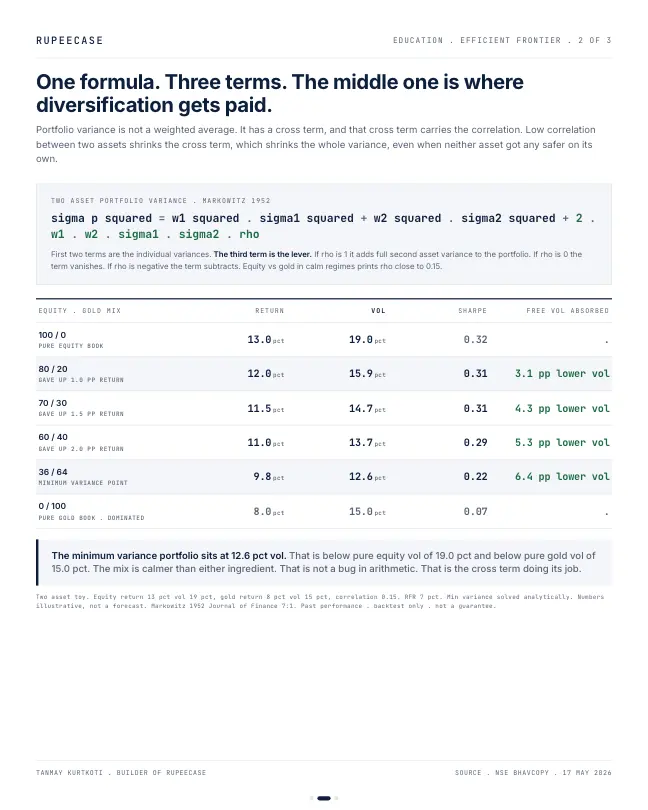
Take the toy. Indian equity at 13 pct expected return and 19 pct annualised vol. Gold at 8 pct return and 15 pct vol. Correlation around 0.15 in calm regimes. Pure equity book sits at 13 / 19. Drop a 20 pct gold sleeve in. The portfolio now sits at 12.0 pct return and 15.9 pct vol.
One pp of return surrendered. Three pp of volatility absorbed. The brochure number went down. The portfolio went up.
The reason is in the variance formula. Portfolio variance is not a weighted average. It carries a cross term. Two times weight one, weight two, vol one, vol two, correlation. When correlation is low the cross term shrinks, and the whole variance shrinks with it. That is the line of math seventy years old that still trips most people on first reading.
Run the mix lower. Seventy thirty lands at 11.5 / 14.7. Sixty forty at 11.0 / 13.7. The minimum variance point in this toy sits at 36 / 64 equity gold, with portfolio vol of 12.6 pct. That number is below pure equity vol of 19, and below pure gold vol of 15. The mix is calmer than either ingredient. That is not a bug in arithmetic. That is the cross term doing its job.
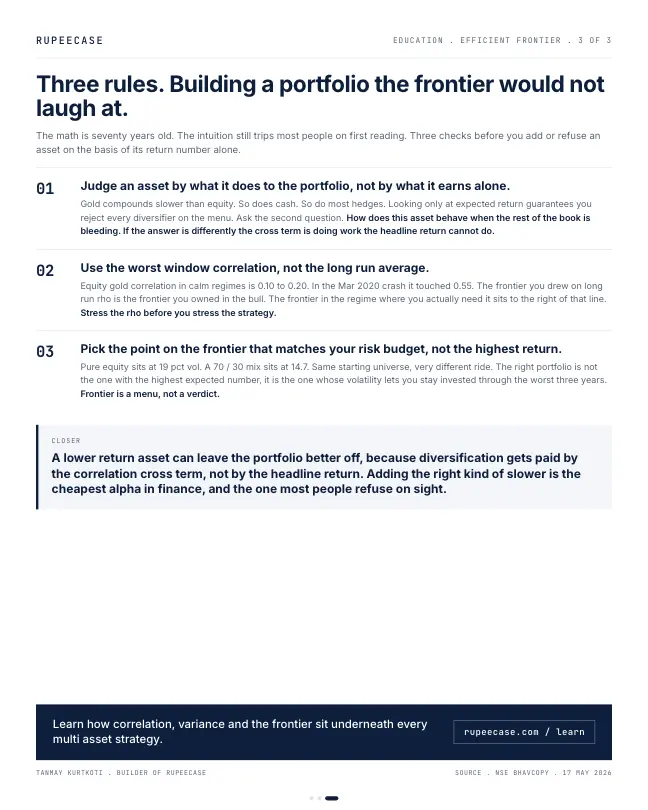
The judgment that follows. Gold compounds slower than equity. So does cash. So do most hedges. If you reject every diversifier on its return number alone, you reject the frontier. The question is not what an asset earns alone. The question is what it does to the portfolio when the rest of the book is bleeding.
The frontier, drawn
Plot every mix of the two assets on one chart, risk across and return up, and you get a curve, not a straight line. The bend is the cross term. Every point on the upper part of the curve is a mix no other mix beats on both return and risk. That upper part is the efficient frontier.
The all gold point sits below and to the right of the 36/64 point. That means a portfolio of only gold is worse on both counts than a mix with 36 percent equity. Nobody would choose it once the curve is drawn.
Run the mix yourself
The calculator below uses the opening's inputs. Change the gold weight and watch return fall in a straight line while volatility falls along a curve.
The same idea on one real Indian year
The toy uses tidy numbers. A real year is messier, and in the year to 30 Sep 2026 gold was not the calm asset at all. An NSE listed gold ETF swung about 26.6 percent a year on its monthly returns, against about 16.9 percent for the Nifty 50. Gold was the more volatile of the two. The correlation of their monthly returns was about 0.20.
Nifty 50 volatility, monthly returns
NSE, 30 Sep 2025 to 30 Sep 2026
Gold ETF volatility, monthly returns
NSE, 30 Sep 2025 to 30 Sep 2026
An 80/20 blend of the two
RupeeCase calculation on the NSE figures
Work it through. Equity variance at 80 percent is 0.64 x 16.9 squared, about 182.8. Gold at 20 percent adds 0.04 x 26.6 squared, about 28.3. The cross term is 2 x 0.8 x 0.2 x 16.9 x 26.6 x 0.20, about 28.8. The total is about 239.9, and its square root is 15.5 percent. A sleeve that was far more volatile than equity still lowered the portfolio's swing, because it moved differently. Over the same year, the gold ETF rose about 26.9 percent while the Nifty 50 fell about 8.1 percent.
One year is not a law. Correlation moves, as the diversification cliff shows for crisis weeks. The structure of the arithmetic does not move.
The free Learn module on modern portfolio theory builds the frontier step by step, covers where its inputs go wrong, and ends with a quiz and a certificate. The asset allocation calculator turns a horizon and a risk level into a starting mix.
Questions readers ask
Why add gold if it returns less than equity?
Because portfolio risk depends on how assets move together, not only on each asset's own swing. In the toy example, a 20 percent gold sleeve gives up 1 point of return and removes about 3 points of volatility, which can leave the portfolio better on return per unit of risk.
What is the efficient frontier in simple words?
It is the set of mixes that give the highest expected return for each level of risk. Any mix below the curve can be beaten on both return and risk by another mix of the same assets.
What is the minimum variance portfolio?
It is the mix with the lowest possible volatility. In the toy example it is 36 percent equity and 64 percent gold, at 12.6 percent volatility, calmer than either asset alone.
The cards
3 cards. Swipe, or tap to open.
Explore next
Learn it properly, then see it applied.
Related
- The diversification cliffIn March 2008 and March 2020 the textbook diversifiers fell together, because correlation is conditional and jumps from 0.10 to 0.55 for equity and gold in a liquidity crunch.Portfolio construction . . 5 min
- Volatility is half the story, correlation decidesAdding 20 percent gold at 15 percent volatility to an 18 percent volatility equity book brings the blend down to 15.0, because gold rarely falls on equity's bad days.Portfolio construction . . 4 min
- The conservative starter is a drawdown number, not a nameMost investors tick the box for a 40 percent drawdown and panic at 15 to 20, which is why the first SIP should be sized to the worst window you would keep adding into.Portfolio construction . . 5 min
Educational content only. Figures are illustrative and computed on historical or representative data for teaching purposes, not investment advice. Past performance does not guarantee future returns. Sourced from NSE, BSE, SEBI, AMFI and RBI public data.