

Costs: MF, PMS, RupeeCase..6 min read
ETF vs index fund: cheaper sticker, not the cheaper hold
A 0.04 percent ETF loses to a 0.07 percent index fund for a monthly SIP once Rs 20 of brokerage, the spread and demat charges land twelve times a year.
By Tanmay Kurtkoti, founder of QC Alpha and builder of RupeeCase
A friend texted me on Saturday, pretty pleased with himself.
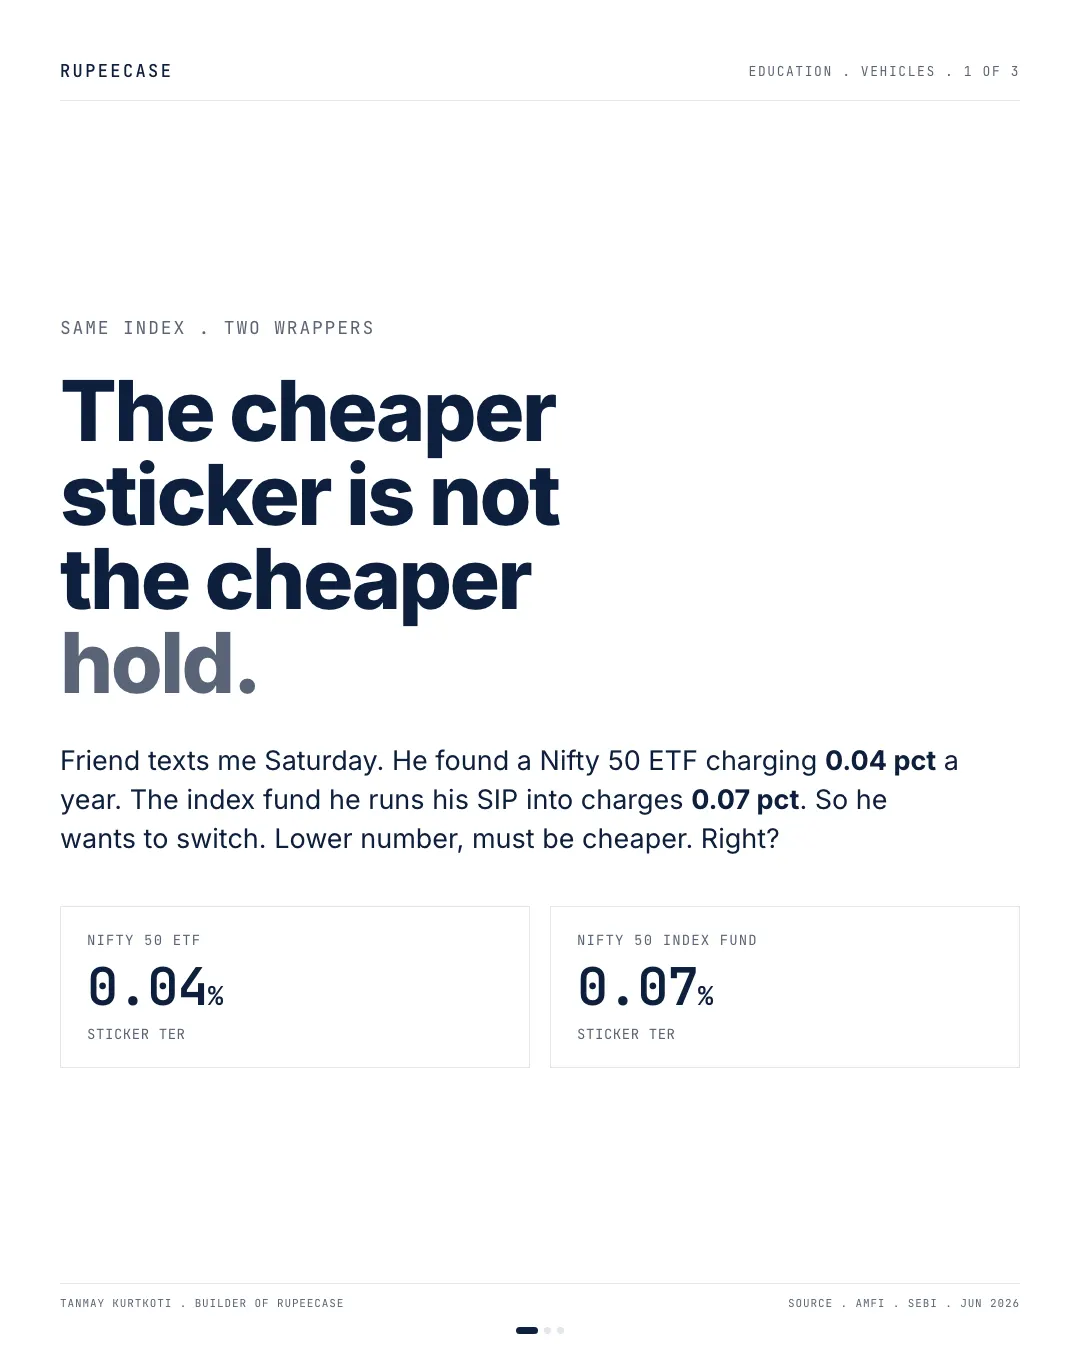
He had found a Nifty 50 ETF charging 0.04 pct a year. The index fund he runs his SIP into charges 0.07. So he wanted to switch and keep the difference. Lower number, must be cheaper.
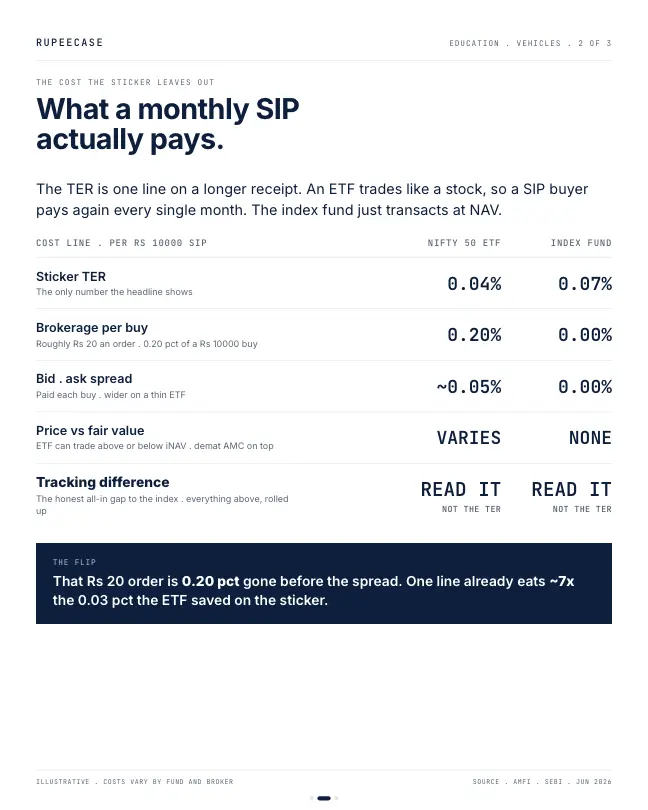
I get why it looks that way. The expense ratio is the one number every comparison leads with. But it is a single line on a longer receipt, and the rest of that receipt only shows up if you know how the two wrappers actually trade.
An index fund transacts at NAV. You send money, you get units at the day's value, done. An ETF trades like a stock. That sounds like a feature until you are a monthly SIP investor, because now you pay the trading costs twelve times a year instead of zero.
Pull the lines the sticker leaves out. On a Rs 10,000 monthly buy you cover brokerage of roughly Rs 20. You cover the bid-ask spread. You fill at whatever price the ETF is quoting against its fair value, with a demat charge sitting underneath all of it. None of that touches the index fund.
Here is the flip. That Rs 20 order alone is 0.20 pct gone, before the spread. One line eats about seven times the 0.03 pct the ETF saved on the sticker.
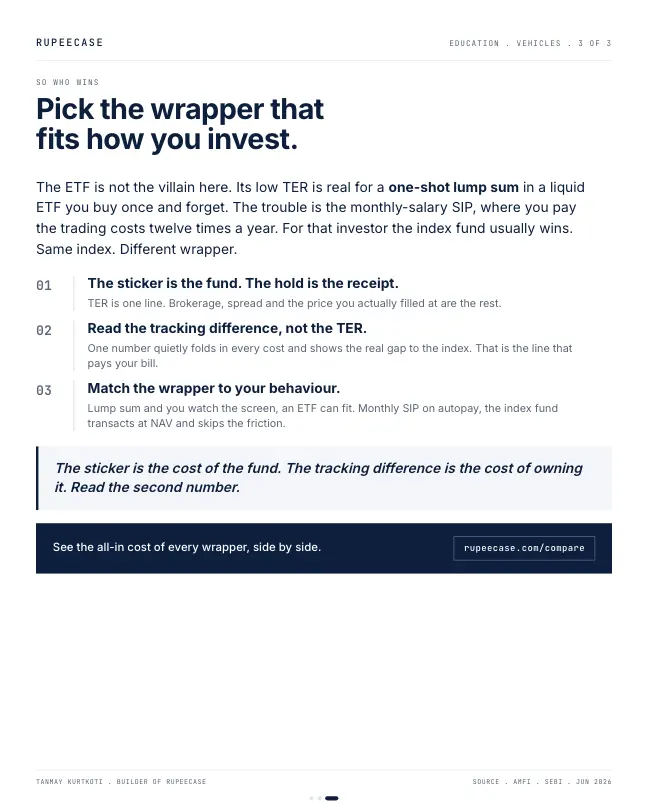
The ETF is not the villain in this. For a one-shot lump sum in a liquid ETF you buy once and forget, that low TER is real money saved. The trouble is the monthly salary on autopay. There the index fund quietly wins.
So read the tracking difference, not the TER. One number folds in every cost and shows the real gap to the index. The sticker is the cost of the fund. The tracking difference is the cost of owning it.
Two wrappers, two ways in
The difference starts with how you buy. You buy index fund units from the fund, at that day's NAV. You buy ETF units from another investor on the exchange, at whatever price the market quotes, through a broker.
Bought from the fund at NAV
- No brokerage, no spread
- Stamp duty of 0.005 percent on units issued
- Works with a SIP mandate
Bought on NSE or BSE at a market price
- Brokerage on every order
- Bid ask spread, and the price can sit above or below the iNAV
- Stamp duty of 0.015 percent on a delivery buy
SEBI's passive fund circular of 23 May 2022 set some of the plumbing that keeps an ETF's price honest. Every ETF must appoint at least two market makers, who quote buy and sell prices. The indicative NAV of an equity ETF, the live value of its basket, must be published on the exchange with a lag of at most 15 seconds. And a direct purchase or redemption with the fund house is allowed only for orders above Rs 25 crore. Below that, the exchange is the only door.
most tracking error an equity index fund or ETF may run, one year rolling
SEBI circular, 23 May 2022
longest lag for an equity ETF's indicative NAV
SEBI circular, 23 May 2022
base expense ratio cap for index funds and ETFs
SEBI board, 17 Dec 2025
A Rs 10,000 SIP, line by line
Now the friend's case in rupees. Rs 10,000 a month, Rs 1,20,000 a year. The ETF charges 0.04 percent a year and the index fund 0.07 percent, both on the money held. On the ETF side, assume Rs 20 of brokerage per order and 0.05 percent lost to spread and premium on each buy; those two are assumptions for the worked example, and they vary by broker and by how liquid the ETF is.
In the first year, with about Rs 1.2 lakh held:
- ETF: Rs 240 of brokerage, Rs 78 of spread and stamp duty, Rs 48 of expense ratio. About Rs 366.
- Index fund: Rs 6 of stamp duty, Rs 84 of expense ratio. About Rs 90.
The interesting part is what happens as the balance grows. The ETF's extra costs sit on the money you put in each month, which stays the same. Its saving sits on the money you hold, which keeps growing. So there is a crossover.
- ETF, Rs 1.2 L heldRs 366
- Index fund, Rs 1.2 L heldRs 90
- ETF, Rs 10.4 L heldRs 734
- Index fund, Rs 10.4 L heldRs 734
- ETF, Rs 20 L heldRs 1,118
- Index fund, Rs 20 L heldRs 1,406
Yearly cost with a Rs 10,000 monthly SIP. ETF 0.04% and index fund 0.07% expense ratio; Rs 20 brokerage and 0.05% spread per ETF buy are assumptions; stamp duty 0.015% and 0.005%. Worked example.
Below about Rs 10.4 lakh held, the index fund is cheaper every year. Above it, the ETF's lower expense ratio starts to win, by Rs 288 a year at Rs 20 lakh. A larger lump sum reaches the crossover on day one, which is why the opening calls the ETF the cheaper choice for a one shot buy.
Tracking difference is the receipt
The opening ends on tracking difference, and SEBI made it easy to find. The same circular requires every index fund and ETF to publish its tracking difference, the yearly gap between the index's return and the fund's NAV return, every month on the fund house's site and AMFI's, for one, three, five and ten years and since launch. It also caps tracking error, the day to day wobble around the index, at 2 percent a year for equity funds.
Tracking difference folds in the expense ratio, the cash the fund holds, and the cost of its own trading. What it does not fold in is your cost of getting in and out of an ETF on the exchange, because that happens in your account, not in the fund's NAV. So for an ETF, read the tracking difference and then add your own brokerage and spread. For an index fund, the tracking difference is close to the whole story.
- Index returnWhat the index earned, dividends included.
- Fund costsExpense ratio, cash held, the fund's own trading.
- Tracking differenceThe published gap. For an index fund, nearly the whole story.
- Your costsFor an ETF only: brokerage, spread, premium to iNAV.
- What you keepThe figure to compare across the two wrappers.
The free Learn module on index funds, ETFs and active funds walks through the evidence in India with calculators and a quiz, and the tracking error calculator measures how closely a fund follows its index. Related: IDCW against Growth and star ratings are the rear view mirror.
Questions readers ask
Is an ETF cheaper than an index fund for a monthly SIP?
Not always. The ETF usually has a lower expense ratio, but every monthly buy pays brokerage, spread and a higher stamp duty. With a Rs 10,000 SIP, Rs 20 brokerage and a 0.03 point expense ratio gap, the index fund stays cheaper until about Rs 10.4 lakh is held.
What is tracking difference in an index fund?
It is the annualised gap between the index's return and the fund's NAV return. SEBI requires every index fund and ETF to publish it monthly for one, three, five and ten years and since launch, on the fund house's and AMFI's websites.
What is the maximum tracking error allowed for an index fund in India?
For equity index funds and ETFs, SEBI's circular of 23 May 2022 caps tracking error at 2 percent, measured on one year rolling data. It can exceed that only in force majeure cases, which must be reported to the trustees.
The cards
3 cards. Swipe, or tap to open.
Explore next
Learn it properly, then see it applied.
Reading path
Stop 4 of 8 on The cost stack
Related
- IDCW vs Growth: the dividend that is your own moneyA fund payout drops the NAV by the same amount and is taxed at slab, so Rs 10 lakh over twenty years ends near Rs 96 lakh in Growth and Rs 69 lakh on the IDCW path.Costs: MF, PMS, RupeeCase . . 6 min
- The tax you pay for someone else's tradesA PMS realises gains in your name every year while a fund defers to exit, and on the same 14 percent gross over ten years the structure alone keeps five to twelve lakh more invested.Costs: MF, PMS, RupeeCase . . 6 min
- Star ratings are the rear view mirrorOnly about one in four top quartile funds is still there a few years later, which is what a coin flip sorted into four buckets would deliver.Costs: MF, PMS, RupeeCase . . 5 min
Educational content only. Figures are illustrative and computed on historical or representative data for teaching purposes, not investment advice. Past performance does not guarantee future returns. Sourced from NSE, BSE, SEBI, AMFI and RBI public data.