

Behaviour..10 min read
Ten days that mattered
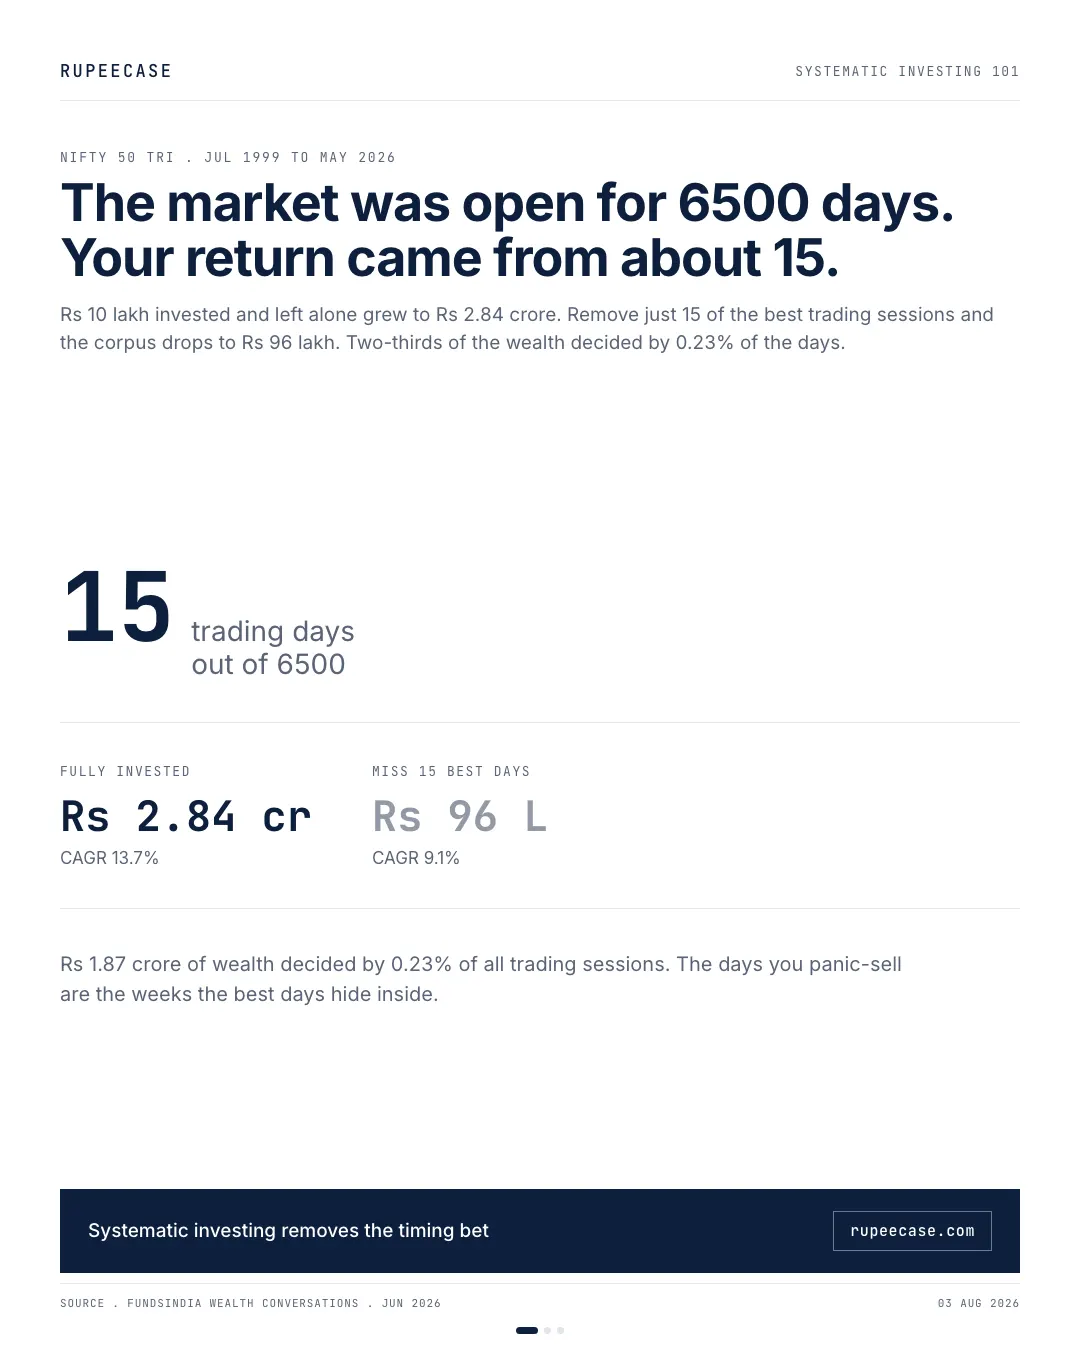
Rs 10 lakh in the Nifty 50 TRI from July 1999 grew to Rs 2.84 crore, or Rs 96 lakh without the 15 best days, seven of which sat within two weeks of the ten worst.
By Tanmay Kurtkoti, founder of QC Alpha and builder of RupeeCase
Saturday morning I am staring at a forwarded message in the family group. Uncle has sold his entire equity portfolio. Two red weeks, a couple of headlines about tariffs, and he is out. "Will buy back when things settle down," he writes. A green-tick emoji. Three likes.
I pulled the Nifty 50 Total Return Index data going back to July 1999. Twenty-six years of trading sessions, roughly 6500 days. Ran one question through it: what happens to a Rs 10 lakh investment if you are sitting on the sidelines for just a handful of the market's strongest sessions?
The answer is the kind of number that should be printed on every brokerage login screen.
Fifteen days out of six thousand five hundred
A Rs 10 lakh lump sum invested in July 1999 and left alone until May 2026 grew to Rs 2.84 crore. A 28.4x multiple. A CAGR of roughly 13.7 percent over 26 years.
Now remove the 15 best trading days from that 26-year stretch. Not the 15 best months. Not the 15 best years. The 15 single best sessions. That is 0.23 percent of all trading days.
The corpus drops to Rs 96 lakh. Two-thirds of the wealth, gone because you were not in the market on fifteen afternoons.
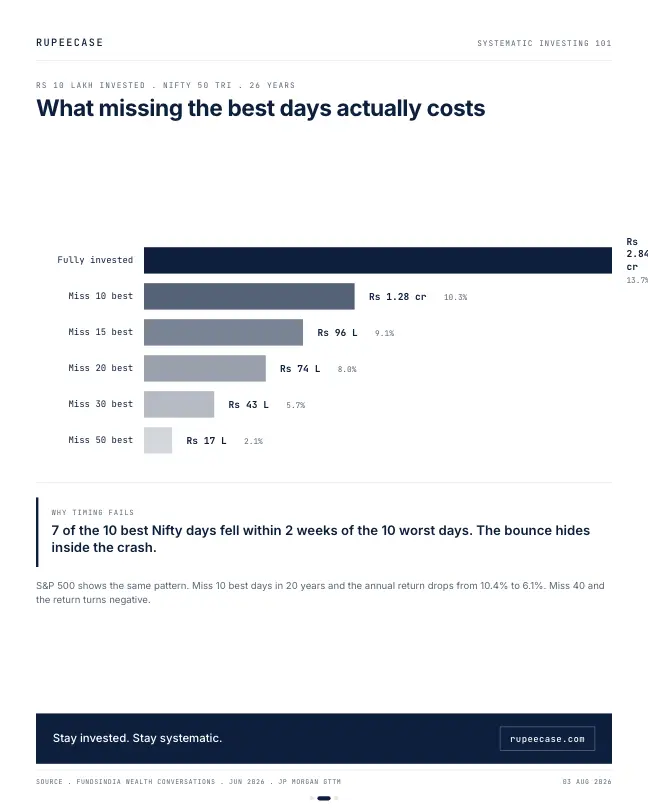
The bars shrink fast. Miss the best 10 days and the corpus drops to Rs 1.28 crore, less than half the fully-invested figure. Miss 30 and you are sitting on Rs 43 lakh. Miss 50 and the Rs 10 lakh has barely grown at all, to Rs 17 lakh over a quarter century. That is a savings account pretending it was an equity investment.
The CAGR tells the same story with a smaller number
The chart is dramatic. The table is quieter but equally brutal. Removing a tiny number of sessions does not just trim the final corpus. It collapses the annualised return itself.
| Days missed | Corpus (Rs) | CAGR | Drop from full |
|---|---|---|---|
| 0 (fully invested) | 2.84 crore | 13.7% | . |
| Best 10 | 1.28 crore | 10.3% | 3.4 pp |
| Best 15 | 96 lakh | 9.1% | 4.6 pp |
| Best 20 | 74 lakh | 8.0% | 5.7 pp |
| Best 30 | 43 lakh | 5.7% | 8.0 pp |
| Best 50 | 17 lakh | 2.1% | 11.6 pp |
Missing just 10 days knocked 3.4 percentage points off the annual return. That sounds modest. It is not. Compound 3.4 percentage points over 26 years and the gap between Rs 2.84 crore and Rs 1.28 crore is Rs 1.56 crore. That gap did not come from a bad fund pick or a wrong sector call. It came from not being in the market on ten afternoons.
Here is that gap as a calculator. Put in the full CAGR and the CAGR after missing the best days, and it shows what each rate does to Rs 10 lakh over the same 26 years.
The S&P 500 shows the same pattern. JP Morgan's Guide to the Markets, one of the most widely cited pieces of institutional research, runs this exercise on a trailing 20-year window. Miss the best 10 days in 20 years and the annualised return drops from about 10.4 percent to 6.1 percent. Miss 40 and the return turns negative. The shape of the curve is the same across geographies and decades.
The trap is that the best days hide inside the worst weeks
Here is the part nobody tells you. If the best days were sprinkled evenly across the calendar, a market timer would only need to avoid being out for a few scattered sessions. Easy enough, in theory. But they are not sprinkled evenly. They cluster. Violently.
Seven of the Nifty 50's ten best trading days in the last 26 years fell within two weeks of its ten worst trading days.
Read that again. The bounce happens right next to the crash. March 23 2020 was one of the worst trading days of the entire dataset. The COVID panic had taken the market down over 30 percent in a few weeks. And the second-best trading day of 2020 came within days of that low. The investors who sold on the way down missed the snap-back. The investors who were too scared to buy missed the recovery that powered the next two years of returns.
The same thing happened this year, on NSE closes you can check. The Nifty 50 fell 15.2 percent between 2 January and 30 March 2026, with three of its worst sessions in that month. A month later it was 7.5 percent off the low.
- Nifty 50 closes at 26,328.55
The starting point for the fall.
- Minus 3.26 percent in one session
The worst day in two years of closes. 23 March (minus 2.60) and 30 March (minus 2.14) follow.
- Close of 22,331.40, 15.2 percent below 2 January
March as a whole: minus 11.31 percent.
- Back to 23,997.55
Up 7.5 percent from the low in one month, for anyone still holding.
<p class="vis-src">NSE, Nifty 50 daily closes (NSE bhavcopy index data), 2 Jan to 30 Apr 2026. Price index, no dividends.</p>
This is why market timing fails in practice even when the call is right in theory. You can correctly identify that the market is overheated. You can sell at a reasonable price. But the moment you step out, you are betting that you will also correctly identify the moment to step back in. And the data says that moment arrives without warning, usually in the middle of exactly the kind of week that makes stepping in feel insane.
Uncle's portfolio is a real-time experiment
The family group sell is not hypothetical. Uncle sold in the last week of a drawdown. He is now sitting in cash, waiting for things to "settle down." Settled for him means a week or two of green closes. By the time those arrive, the market will have already priced in whatever recovery was coming. The best days will have passed. He will buy back at a higher price than he sold, having locked in the loss and missed the recovery, and he will call it "being careful."
I have seen this cycle run three times in the same family group. March 2020 (COVID crash, sold, missed the fastest rally in history). October 2021 (FII sell-off, sold, re-entered 8 percent higher). June 2022 (rate-hike panic, sold, came back after the August bounce). Each time the stated reason was caution. Each time the actual cost was the best days sitting inside the worst weeks.
What would you do?
It is the close on 30 Mar 2026. The Nifty 50 is 15.2 percent below where it began the year, and the family group is selling.
- Sell and buy back when things settle
By 30 Apr 2026 the index was 7.5 percent above your exit, and by 31 Jul it was 9.2 percent above it. Waiting for calm meant buying back higher.
- Stay with the plan
You owned the 7.5 percent rebound in April. By 9 Oct 2026 the index was at 22,520.45, back near the March low, which is the honest part: staying is a rule, not a forecast.
NSE, Nifty 50 closes: 22,331.40 (30 Mar 2026), 23,997.55 (30 Apr), 24,383.60 (31 Jul), 22,520.45 (9 Oct 2026). Price index.
The honest caveat
This argument has limits and they are worth naming.
First, the exercise assumes you miss only the best days and are present for all the others, including the worst. In reality, a market timer who is out during a crash might also avoid some of the worst days. FundsIndia's own data shows that removing both the best AND worst days narrows the gap. The full 26-year return still wins, but by less.
Second, staying fully invested means riding every drawdown to its floor. In 2008 the Nifty fell over 50 percent. In early 2020 it fell 38 percent in a month. Sitting through those drops requires a specific kind of discipline that this chart does not depict. The chart shows the reward for patience. It does not show the 3 AM staring-at-the-ceiling cost of earning it.
Third, this is about lump-sum buy-and-hold. A systematic investor running a disciplined rebalancing framework does not just sit still. They buy more when things fall and trim when things run. That is not timing. That is a rule. The rebalancing calendar removes the decision from the moment, which is exactly the point.
Three rules from the data
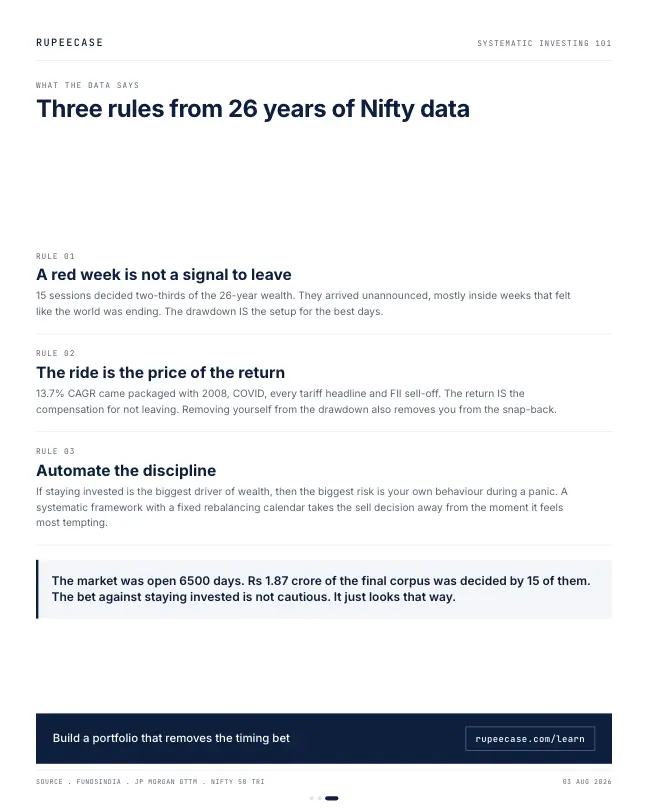
Stop treating a drawdown as a signal to leave. A red week is not information about next week. It is noise dressed as urgency. The 15 sessions that decided two-thirds of the 26-year wealth were not scheduled in advance. They arrived unannounced, mostly in the middle of weeks that felt like the world was ending.
MythI will sell now and buy back once things settle down.
FactSettled usually means a week or two of green closes, and the sharpest up days tend to come before that, close to the worst ones. The sell is one decision. The return needs two correct ones.
Accept that the ride is the price of the return. The 13.7 percent CAGR was never free. It came packaged with 2008, with COVID, with every tariff headline and every FII sell-off. The return IS the compensation for not leaving during those stretches. Removing yourself from the drawdown also removes you from the snap-back. They are the same trade.
Automate the discipline. If staying invested is the single largest driver of long-term wealth, then the biggest risk is your own behaviour during a panic. A systematic framework with a fixed rebalancing calendar takes the sell decision away from the moment it feels most tempting. That is not laziness. That is architecture.
The market was open for roughly 6500 days over those 26 years. Rs 1.88 crore of the final corpus was decided by 15 of them. Uncle is betting he can sit out the bad weeks and walk back in for the good days. The data says 7 of the 10 best days were hiding inside the worst weeks. The bet is not cautious. It just looks that way in a group chat.
Two decisions, not one
Timing is sold as one call: get out before the fall. It is two calls, out and back in, and both have to be right. The data in this post says the second call is the harder one, because the days that reward it arrive while the news is still bad. The free Learn module on why investors lose puts this next to the other gaps between what a fund earns and what its investors earn. The same idea, applied to SIPs, is in the default decides.
Questions readers ask
What happens if you miss the 10 best days in the Nifty 50?
In the study quoted here, Rs 10 lakh in the Nifty 50 TRI from July 1999 to May 2026 grew to Rs 2.84 crore fully invested and Rs 1.28 crore after missing the 10 best sessions. The CAGR fell from about 13.7 percent to 10.3 percent.
Why is it hard to time the market in India?
Because the strongest sessions tend to sit close to the weakest ones. In March 2026 the Nifty 50 fell 15.2 percent from its 2 January close, then rose 7.5 percent in the month after the 30 March low, before most sellers felt it was calm enough to return.
Does staying invested mean never selling?
No. It means the decision to sell comes from a rule set in advance, such as a rebalance date or an allocation band, rather than from a red week. A rule can still trim or exit; it just does not do it in a panic.
The cards
3 cards. Swipe, or tap to open.
Explore next
Learn it properly, then see it applied.
Reading path
Stop 9 of 10 on Start here
Related
- The default decides more than the advice doesMissing three instalments a year on a Rs 10,000 SIP cuts a twenty year corpus by 23.9 percent, and a skip in month one costs 9.7 times a skip in month 229.Behaviour . . 12 min
- The behaviour gap: fund return vs investor returnIndian equity funds returned 19.1 percent a year from 2003 to 2022 while the rupees investors actually put in earned 13.8, and SIP investors earned 15.2.Behaviour . . 5 min
- Pausing a SIP in a downturn is the most expensive instinctOn identical money and the same exit, the investor who kept buying through a 40 percent fall ended with 329 more units and Rs 39,471 more than the one who paused.Behaviour . . 5 min
Educational content only. Figures are illustrative and computed on historical or representative data for teaching purposes, not investment advice. Past performance does not guarantee future returns. Sourced from NSE, BSE, SEBI, AMFI and RBI public data.