

Returns and risk maths..5 min read
TRI vs price index: which Nifty
The total return index runs about 1.3 points a year hotter than the TV number, enough to turn a fund that beat the price index by Rs 2.89 lakh into one that trailed by Rs 0.91 lakh.
By Tanmay Kurtkoti, founder of QC Alpha and builder of RupeeCase
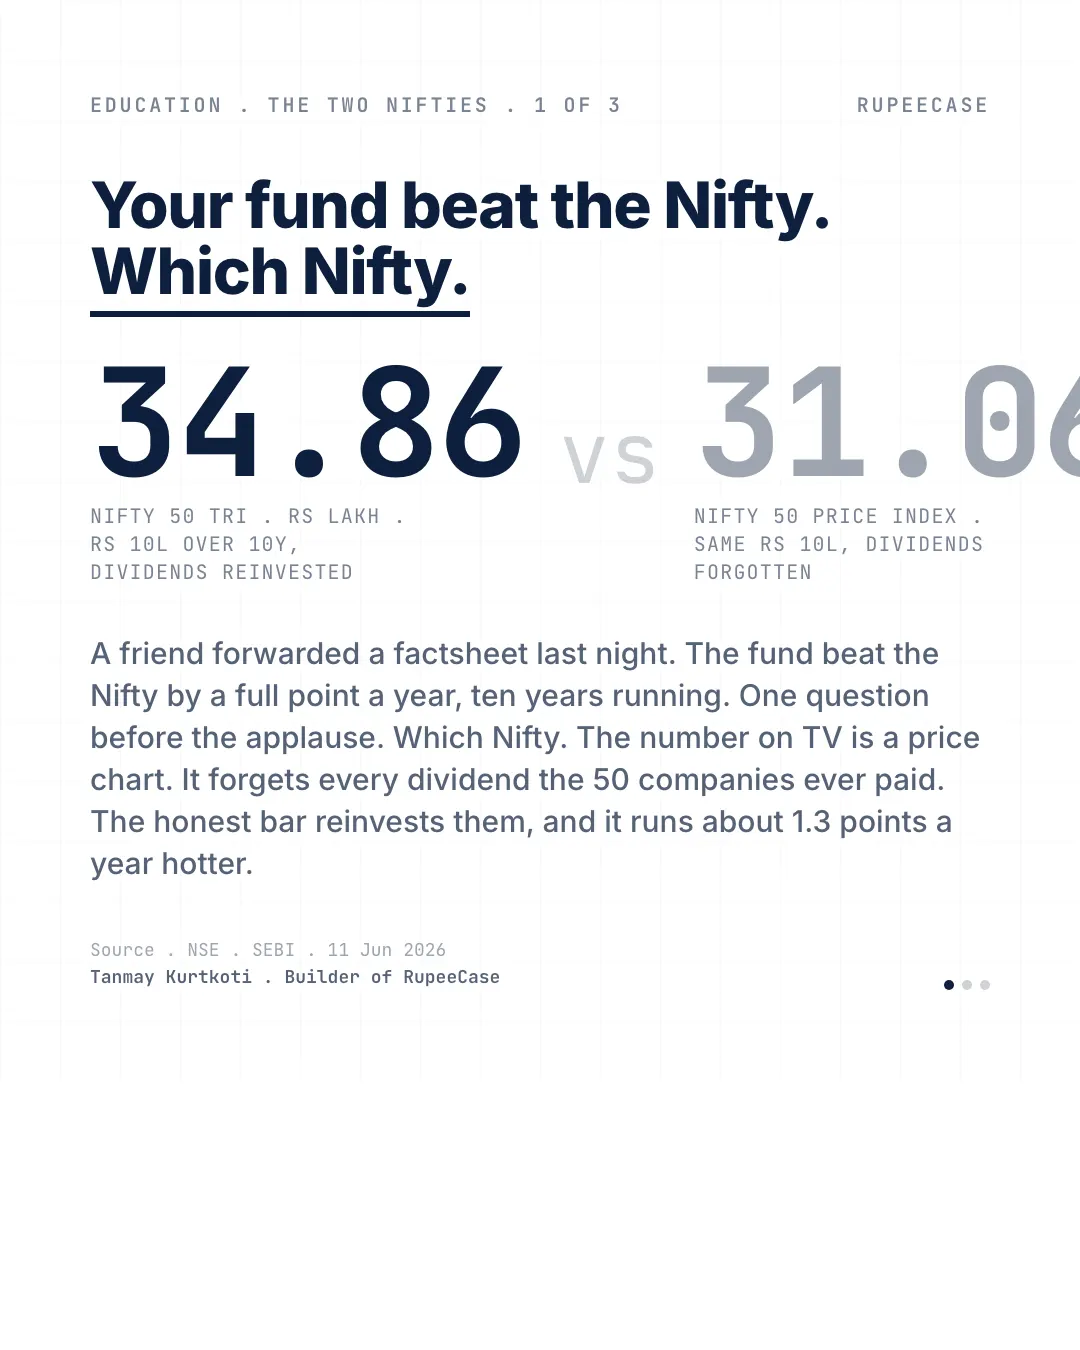
A friend forwarded me a fund factsheet last night. The pitch line was right at the top. Beat the Nifty by a full point a year, ten years running.
I asked him one question before the congratulations. Which Nifty.
Here is the part most people miss. The Nifty you see on TV is a price index. It tracks what the 50 stocks trade at and nothing else. Every dividend those companies have ever paid, and they pay a lot, simply vanishes from that chart. But if you actually own the stocks, or an index fund holding them, those dividends land in your account and compound. The honest bar is the TRI, the total return index, which reinvests every payout. It runs roughly 1.3 percentage points a year hotter than the TV number.
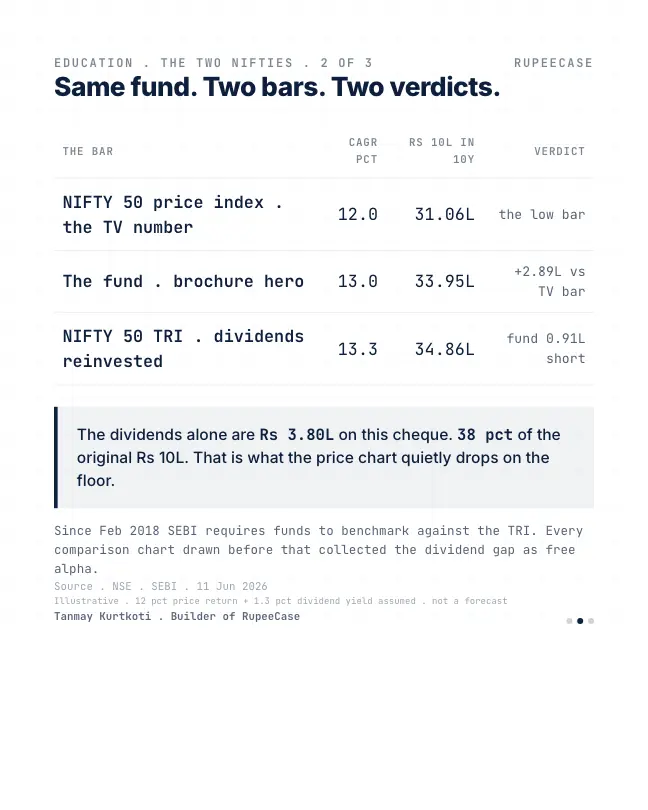
So I ran my friend's factsheet through both bars. Rs 10 lakh for ten years. The price index at 12 percent grows to about Rs 31.06 lakh. His fund at 13 percent grows to about Rs 33.95 lakh. The TRI at 13.3 percent grows to about Rs 34.86 lakh. Against the TV chart the fund is a hero, ahead by Rs 2.89 lakh. Against the bar that includes the dividends, it is Rs 0.91 lakh short. Same fund, same decade, two completely different verdicts.
The dividends alone are Rs 3.80 lakh on that cheque. Thirty eight percent of the original investment, quietly dropped on the floor by the wrong chart.
SEBI saw the trick and forced funds to benchmark against the TRI from February 2018. Which means any proud long-term comparison that starts before that date collected the dividend gap as free alpha for years.
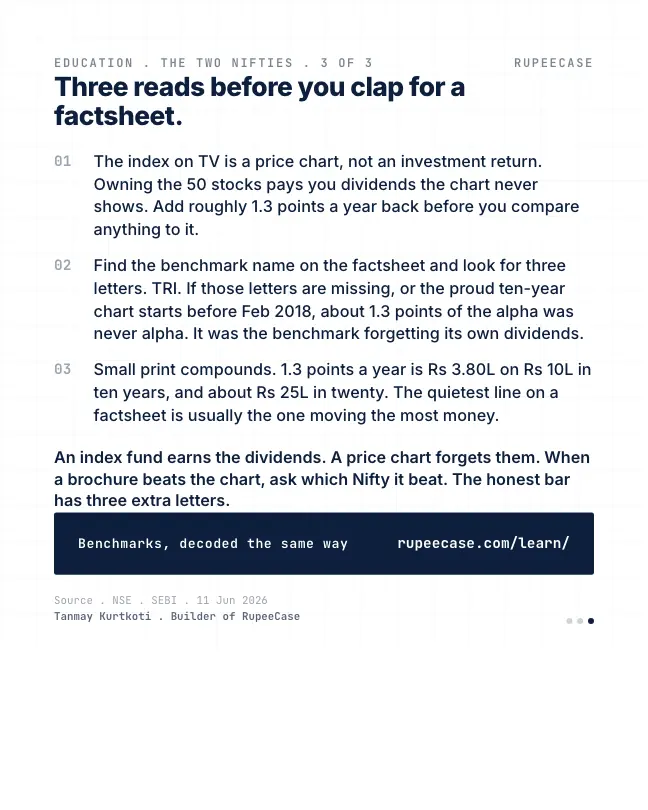
The read is simple. Open the factsheet, find the benchmark name, look for three letters. TRI. If they are missing, add 1.3 points back and see if the applause survives.
Where the 1.3 points come from
A price index moves only with the prices of its stocks. When a company pays a dividend, its share price usually drops by about the dividend on the ex date, and the price index drops with it. The money did not disappear. It went to the shareholders. The price index just stopped counting it.
The Total Return Index adds that money back as if it were reinvested in the index on the same day. So over a year the gap between the two is roughly the dividend yield of the index.
On 30 Sep 2026, NSE data showed the Nifty 50 with a dividend yield of 1.22 percent. On Rs 10,00,000 held in the 50 stocks, that is about Rs 12,200 a year in dividends at that yield, before tax. The yield moves with prices and payouts, which is why the gap is never one fixed number. The 1.3 points in my friend's example is a round figure in that neighbourhood.
The friend's factsheet, redone
Here is the same Rs 10 lakh for ten years, against both bars. You can check each line with a calculator that has a power key.
Price index at 12 percent: Rs 10,00,000 x 1.12 ^ 10 = about Rs 31.06 lakh.
The fund at 13 percent: Rs 10,00,000 x 1.13 ^ 10 = about Rs 33.95 lakh.
TRI at 12 plus 1.3, so 13.3 percent: Rs 10,00,000 x 1.133 ^ 10 = about Rs 34.86 lakh.
- Price index, 12%Rs 31.06 L
- The fund, 13%Rs 33.95 L
- TRI, 13.3%Rs 34.86 L
Rs 10 lakh for ten years. Worked example from the post, not a real fund. Adding the yield to the price return is a close approximation of the TRI.
Run your own fund through the same test. Put in the fund's CAGR, the price index CAGR over the same dates, and a dividend yield.
What SEBI changed in 2018
SEBI's circular of 4 Jan 2018 told mutual funds to benchmark scheme performance against the Total Return Index version of their benchmark, from 1 Feb 2018. The reason was simple: a fund collects the dividends of the stocks it holds, so comparing it with an index that drops them flatters the fund by roughly the dividend yield every year.
So when you read a factsheet today, the benchmark line should say TRI. When you read an older brochure, a blog post or a comparison chart from anywhere, it may not. That is where the 1.3 points still hide.
- Find the benchmarkIt is named in the scheme details on the factsheet.
- Look for TRINifty 50 TRI, Nifty 500 TRI. No TRI means a price index.
- Match the datesFund and index over the same start and end.
- Add the yield backIf the chart uses a price line, add roughly the dividend yield each year and look again.
We use the Nifty 50 TRI as the reference line beside our model strategies for the same reason. The free Learn module on indices and benchmarks explains how NSE builds price and total return indices and which benchmark fits which portfolio. Two related posts: average return against CAGR and what a fixed deposit really earns.
Questions readers ask
What is the difference between Nifty 50 and Nifty 50 TRI?
The Nifty 50 is a price index: it tracks only the prices of its 50 stocks. The Nifty 50 TRI adds back every dividend those stocks pay, as if reinvested. Over a year the TRI usually runs ahead by about the dividend yield, which NSE showed at 1.22 percent on 30 Sep 2026.
Why do mutual funds compare with TRI and not the normal index?
Because a fund receives the dividends of the shares it holds. SEBI's circular of 4 Jan 2018 required funds to use the TRI version of their benchmark from 1 Feb 2018, so the comparison is like for like.
How much do dividends add to Nifty returns?
Roughly the dividend yield each year, which NSE showed at 1.22 percent for the Nifty 50 on 30 Sep 2026. Over ten years that compounds into a large gap: on Rs 10 lakh, 12 percent against 13.3 percent is about Rs 3.8 lakh.
The cards
3 cards. Swipe, or tap to open.
Explore next
Learn it properly, then see it applied.
Reading path
Stop 5 of 8 on What a return number hides
Related
- Average return vs CAGRUp 50 then down 50 averages zero and loses a quarter of the money, and two funds averaging 12 percent at 8 and 30 percent volatility end twenty years at Rs 91 lakh and Rs 42 lakh.Returns and risk maths . . 5 min
- The long run makes the rate safe and the rupees wildTwenty years narrows the annualised range to about 6 to 15 percent while the rupee outcome on Rs 10 lakh fans out from Rs 31 lakh to Rs 1.56 crore.Returns and risk maths . . 5 min
- After tax and inflation, safe can go backwardsA 7 percent fixed deposit nets about 4.9 after top slab tax and roughly zero after 5 percent inflation, so Rs 10 lakh that doubled on paper buys less than it did.Returns and risk maths . . 5 min
Educational content only. Figures are illustrative and computed on historical or representative data for teaching purposes, not investment advice. Past performance does not guarantee future returns. Sourced from NSE, BSE, SEBI, AMFI and RBI public data.