

Returns and risk maths..5 min read
Sharpe, Sortino, Calmar: three leaderboards
The same three funds rank differently under Sharpe, Sortino and Calmar, and in withdrawal phase Calmar is the bar because drawdown does not average out.
By Tanmay Kurtkoti, founder of QC Alpha and builder of RupeeCase
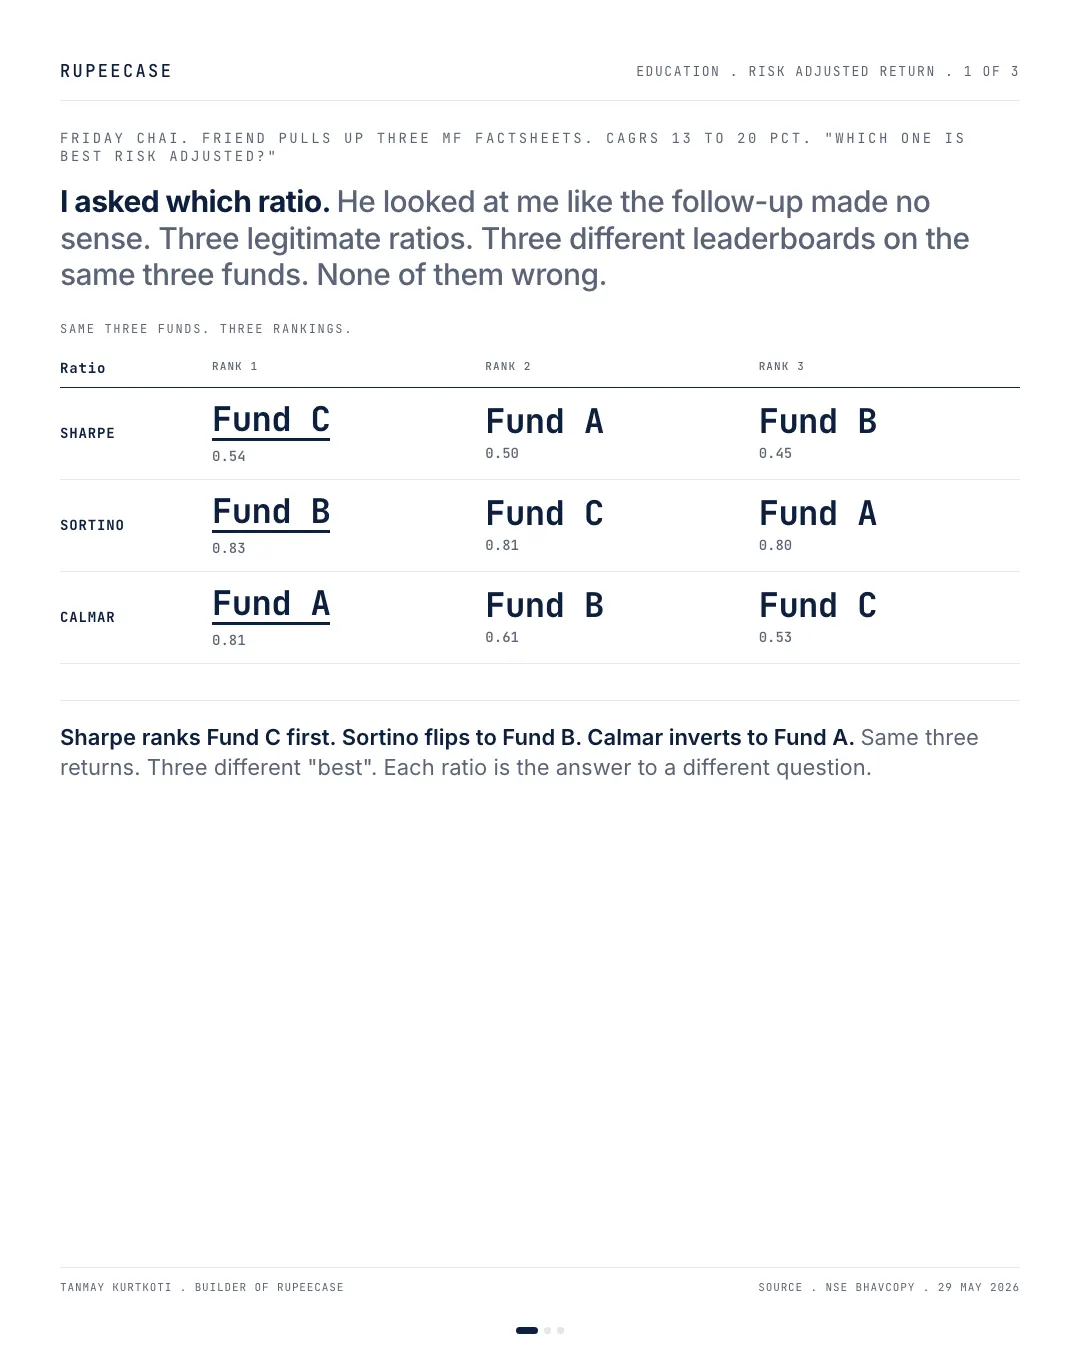
Friend pulled up three MF factsheets at Friday chai. CAGRs hovering between 13 and 20 pct on the same five-year window. The question was simple. "Which one is best risk-adjusted."
I asked which ratio.
He looked at me like the follow-up made no sense. Three legitimate ratios. Three different leaderboards. None of them wrong.
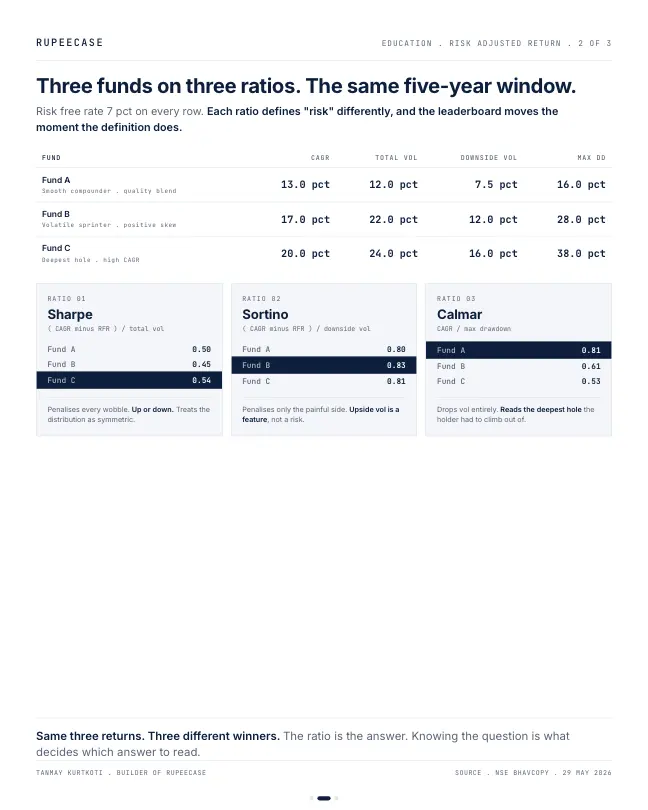
The three funds. Fund A 13 pct CAGR 12 pct total vol 16 pct max drawdown. Smooth compounder. Fund B 17 pct CAGR 22 pct vol 28 pct max drawdown. Volatile sprinter. Fund C 20 pct CAGR 24 pct vol 38 pct max drawdown. Deepest hole. RFR 7 pct on every row.
Sharpe takes return minus RFR over total vol. Treats every wobble as risk. Up or down. Leaderboard goes Fund C 0.54, Fund A 0.50, Fund B 0.45.
Sortino does the same arithmetic over downside vol only. Treats upside vol as a feature, not a risk. Flips the leaderboard to Fund B 0.83, Fund C 0.81, Fund A 0.80.
Calmar drops vol entirely. CAGR over max drawdown. Asks how deep the hole was that the holder had to climb out of. Inverts the leaderboard to Fund A 0.81, Fund B 0.61, Fund C 0.53.
Same three returns. Three different "best."
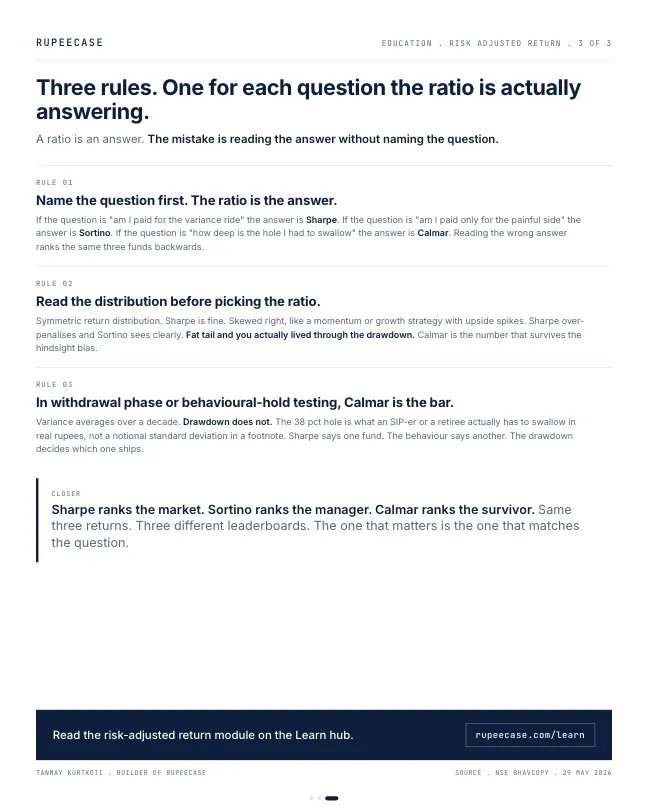
Each ratio answers a different question. Sharpe asks whether the return is paid for the variance ride. Works for symmetric distributions and broad benchmarks. Sortino asks whether the return is paid for the painful side of variance. Works for skewed strategies where upside spikes look like risk to Sharpe and don't bother an actual holder. Calmar asks how big the hole was. Works for withdrawal-phase portfolios and behavioural-hold testing where a 38 pct drawdown is what an investor actually has to swallow, not a notional sigma in a footnote.
Three rules I read every factsheet by. Name the question first because the ratio is the answer. Read the distribution before picking the ratio because symmetric Sharpe, skewed Sortino, lived-through Calmar. In withdrawal phase or behavioural-hold testing Calmar is the bar because variance averages over a decade and drawdown does not.
Sharpe ranks the market. Sortino ranks the manager. Calmar ranks the survivor. Same three returns. Three different leaderboards. The one that matters is the one that matches the question
The three formulas, on one line each
Here is the arithmetic for Fund C, the deepest hole of the three, so you can redo the whole table yourself.
Sharpe: (20 minus 7) divided by 24 = 0.54. Excess return over total volatility.
Sortino: (20 minus 7) divided by downside volatility. Fund C's downside volatility works out near 16, so 13 divided by 16 = 0.81. Only the falling months count in the denominator.
Calmar: 20 divided by 38 = 0.53. CAGR over the maximum drawdown, no volatility at all.
Now change one input that most people never touch: the risk free rate. The 7 percent in the example is a round number. The RBI's repo rate was 5.50 percent after its policy of 7 Oct 2026. Put 5.5 in the box and run all three funds again. Fund A's Sharpe rises to (13 minus 5.5) / 12 = 0.63. Fund C's rises to (20 minus 5.5) / 24 = 0.60. The Sharpe leaderboard flips from C first to A first, and nothing about either fund changed. Only the hurdle did.
That is worth knowing before you trust any single Sharpe ratio on a factsheet. Ask which risk free rate sits under it.
Our own model lines, ranked two ways
The lineup file publishes a Sharpe ratio, a CAGR and a maximum drawdown for every model strategy, so I can build a Calmar for each one and see whether the order holds.
- Large Midcap, Sharpe 1.691.96
- Smallcap, Sharpe 1.591.67
- Midcap, Sharpe 1.491.56
- Microcap, Sharpe 1.521.41
- Energy, Sharpe 1.120.84
Bars show Calmar = CAGR over max drawdown, from lineup.json (for example Microcap 37.33 over 26.43). Model, back tested, as of 27 Apr 2026.
Two pairs are worth a look. Microcap has the higher Sharpe of the two, 1.52 against Midcap's 1.49. On Calmar, Midcap is ahead, 1.56 against 1.41, because Microcap's worst fall was deeper at minus 26.43 percent against minus 24.87 percent (Model, back tested, as of 27 Apr 2026). And the Energy Basket model, with a Sharpe of 1.12, sits right beside the Nifty 50 Equal Weight model at 1.13. Its Calmar is 0.84 against 1.04 for Equal Weight, because its maximum drawdown was minus 39.48 percent. Similar Sharpe, very different hole to sit through.
None of these is the right ranking. Each one answers its own question.
Picking the ratio before the fund
- Write the question downPaid for the ride? Paid for the pain? How deep was the hole?
- Look at the shapeAre returns roughly symmetric, or do big up months skew them?
- Pick the ratioSharpe for symmetric, Sortino for skewed upside, Calmar for drawdown you must live through.
- Fix the inputsSame window, same risk free rate, same data frequency for every fund you compare.
- Then rankOnly now does the leaderboard mean something.
The fourth step is where most comparisons break. A Sharpe built on three years of monthly data and one built on five years of daily data are not the same number, even for the same fund. Calmar is especially sensitive to the window: one bad month added or dropped can move the maximum drawdown a long way.
For someone drawing money out of a portfolio, I lean on Calmar and drawdown more than on Sharpe. A withdrawal taken during a deep fall sells units at the worst prices, and those units never come back to compound. Volatility averages out over a decade. A drawdown in the year you need the money does not.
MythThe fund with the highest Sharpe ratio is the best risk adjusted fund.
FactIt is the best on one definition of risk. Change the risk to downside volatility or drawdown and the order can flip, as Midcap and Microcap do above.
The free Learn module on performance measurement works through Sharpe, Sortino, Calmar, alpha and tracking error with quizzes and a certificate. The Sharpe ratio on its own gets a full post in Sharpe ratio decoded.
Questions readers ask
What is the difference between Sharpe and Sortino ratio?
Both divide the return above the risk free rate by a measure of risk. Sharpe uses total volatility, so big up months count as risk too. Sortino uses only downside volatility, so a fund with sharp rallies and mild falls scores better on Sortino than on Sharpe.
What is a good Calmar ratio?
There is no fixed cut off, because Calmar depends heavily on the window measured. Above 1 means the yearly return was larger than the worst fall in that window. Compare Calmar only between funds measured over the same dates.
Which risk free rate should I use for Sharpe ratio in India?
Common choices are a short Treasury bill yield or the RBI repo rate, which was 5.50 percent after the 7 Oct 2026 policy. The choice matters: a lower rate lifts every Sharpe and can change the order between funds. Use the same rate for every fund you compare.
The cards
3 cards. Swipe, or tap to open.
Explore next
Learn it properly, then see it applied.
- GuideHow to compare two investment strategies: seven checks, worked on two real rulesSeven checks past the headline return, worked on two rules with the same CAGR.
- Free module 2.3Risk Metrics That Matter8 min read
- StrategyAllcap strategyNifty Total Market, 50 stocks, every 2 weeks
- CalculatorLumpsum calculatorFree, with the formula and a worked example
Related
- Sharpe ratio decoded: same CAGR, different rideTwo funds at 14 percent CAGR can carry Sharpe ratios of 0.58 and 0.32, and anything above 1.5 over a real ten year window earns the right to be questioned before it is trusted.Returns and risk maths . . 5 min
- Volatility drag: same average, six lakh gapTwo funds printing a 12 percent average return ended at Rs 28.4 lakh and Rs 21.8 lakh on the same Rs 10 lakh, because the drag scales with volatility squared.Returns and risk maths . . 6 min
- Rolling returns vs CAGRA point to point CAGR is a chosen story, and the Nifty 50 TRI's rolling five year windows since 2002 ranged from minus 1.2 to plus 22.4 percent a year.Returns and risk maths . . 5 min
Educational content only. Figures are illustrative and computed on historical or representative data for teaching purposes, not investment advice. Past performance does not guarantee future returns. Sourced from NSE, BSE, SEBI, AMFI and RBI public data.