

Returns and risk maths..5 min read
Average return vs CAGR
Up 50 then down 50 averages zero and loses a quarter of the money, and two funds averaging 12 percent at 8 and 30 percent volatility end twenty years at Rs 91 lakh and Rs 42 lakh.
By Tanmay Kurtkoti, founder of QC Alpha and builder of RupeeCase
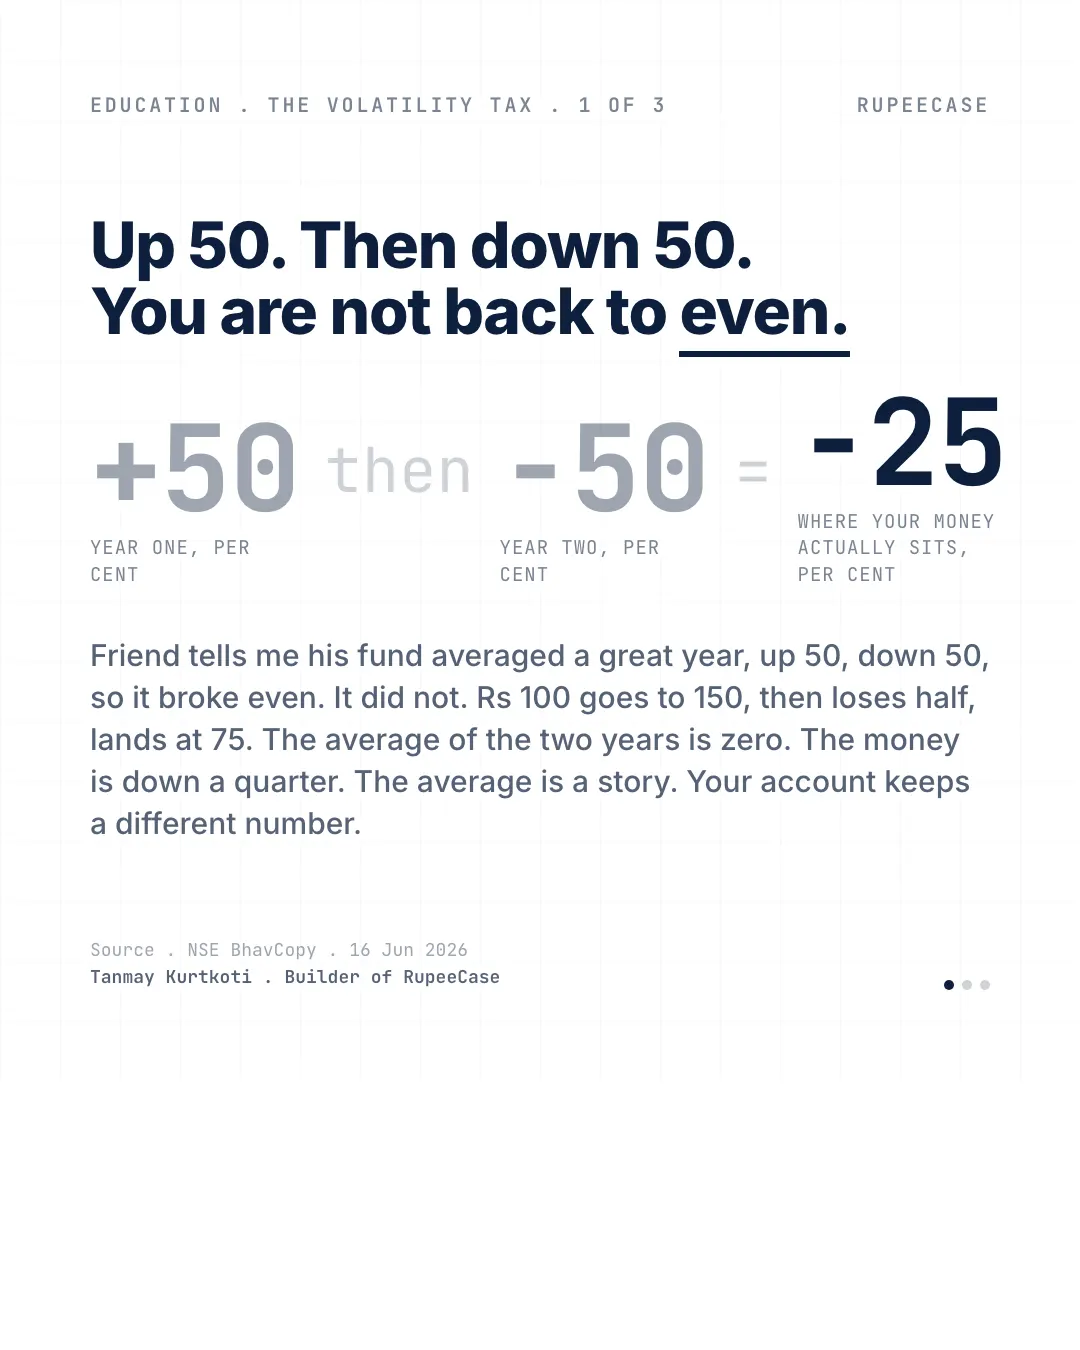
A friend told me last week his fund had averaged a great year. Up 50 percent, then down 50. So it broke even, he figured.
It did not. Rs 100 goes to 150, then loses half of that, and lands at 75. He is down a quarter. The average of the two years is zero. The money is down 25 percent. Two different numbers, and only one of them pays for anything.
This is the quietest trap in investing. The number a fund advertises is the average return. The number your money actually earns is the CAGR, the rate that compounds. They match only when the path is a straight line, and no fund rides a straight line. Every swing pulls the two apart, and the wilder the swings, the wider the gap.
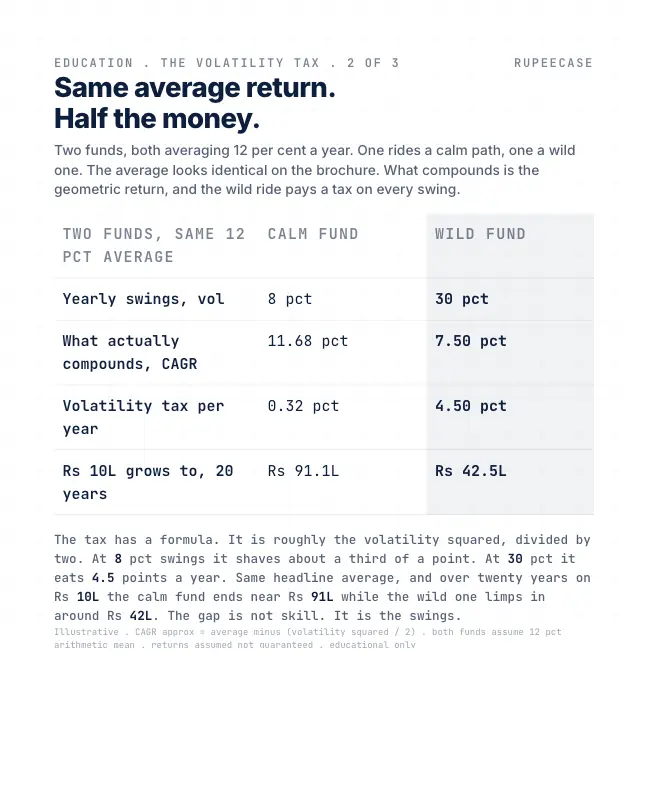
Here is where it starts costing money. Picture two funds, both averaging 12 percent a year. Identical on the brochure. One swings 8 percent, the other 30. What actually compounds is 11.68 percent against 7.50. Put Rs 10 lakh in each for twenty years and the calm fund lands near Rs 91 lakh while the wild one limps in around Rs 42 lakh. Same average. Half the money.
The drag has a formula. Close to the volatility squared, divided by two. At 8 percent swings it shaves a third of a point a year. At 30 percent it eats four and a half points, taken before you ever see the headline.
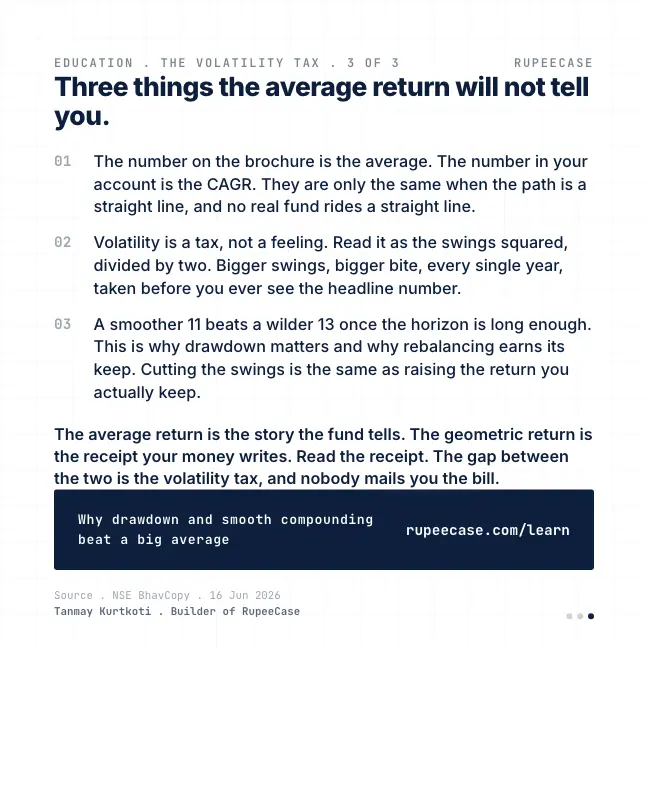
Three things I keep coming back to. The brochure shows the average, your account shows the CAGR, and only the second is real. Volatility is a tax, not a vibe. And a smoother 11 beats a wilder 13 over a long enough horizon, which is the whole reason drawdown matters and rebalancing earns its keep.
The average return is the story the fund tells. The geometric return is the receipt your money writes. The gap between them is the volatility tax, and nobody mails you the bill.
Up 50, down 50, drawn out
The friend's two years are the cleanest way to see the gap, so here they are on one picture.
The CAGR is the steady rate that would have got you from Rs 100 to Rs 75 in two years: 0.75 ^ (1 / 2) minus 1 = minus 13.4 percent a year. That is the number that matches the money.
Try any pair of years yourself. The average and the CAGR only agree when both years are the same.
A real example: the bigger average lost
Textbook pairs are easy to dismiss, so I went to our own model lines. I took the month end values at each December and worked out four calendar years, 2022 to 2025, for two of them.
| Model | 2022 | 2023 | 2024 | 2025 |
|---|---|---|---|---|
| Healthcare | -19.6 | 57.5 | 40.1 | 0.5 |
| Nifty 50 EW | 9.2 | 34.2 | 17.9 | 11.6 |
Calendar year returns from December month end values of the monthly model curves. RupeeCase lineup.json. Model, back tested, as of 27 Apr 2026.
Now do the two calculations for each row.
The Healthcare Basket model averages (minus 19.6 + 57.5 + 40.1 + 0.5) / 4 = 19.6 percent. Multiply the years instead: 0.804 x 1.575 x 1.401 x 1.005 = 1.783. The CAGR is 1.783 ^ (1 / 4) minus 1 = 15.6 percent.
The Nifty 50 Equal Weight model averages 18.2 percent. Its four years multiply to 1.928, a CAGR of 17.8 percent.
points lost between average and CAGR, Healthcare model
19.6 against 15.6. Model, back tested, as of 27 Apr 2026
points lost, Nifty 50 Equal Weight model
18.2 against 17.8. Model, back tested, as of 27 Apr 2026
The model with the higher average, 19.6 against 18.2, compounded slower, 15.6 against 17.8. One minus 19.6 percent year did most of the damage: everything after it had to rebuild a smaller base. Rs 1,00,000 in each at the end of 2021 would have been about Rs 1.78 lakh and Rs 1.93 lakh four years later.
Four years is a short window, and I would not read anything about the future into these two lines. The point is narrower. Rank by the average and you pick Healthcare. Rank by what the money did and you pick Equal Weight.
Why the brochure prefers the average
The average of yearly returns is always equal to or higher than the CAGR over the same years. They are equal only when every year is identical. So when someone wants a bigger number, the average is the honest looking way to get it. Nothing in it is false. It just answers a question nobody's account asks.
MythA fund that averaged 12 percent a year turned Rs 10 lakh into what 12 percent compounding would give.
FactOnly if every year was 12 percent. With 30 percent swings the same average compounds near 7.5 percent: about Rs 42 lakh over twenty years, not Rs 96 lakh.
For the twenty year pair in the opening, the receipts are Rs 10,00,000 x 1.1168 ^ 20 = about Rs 91 lakh and Rs 10,00,000 x 1.075 ^ 20 = about Rs 42 lakh. The volatility version of this idea, with the squared rule worked through, is in volatility drag.
The free Learn module on performance measurement covers CAGR, rolling returns and the risk adjusted ratios with quizzes and a certificate.
Questions readers ask
Why is CAGR lower than the average return?
Because a loss cuts the base that every later gain works on. The simple average treats each year as if it started from the same amount, and it never does. The two agree only when every year has the same return.
Which return should I use to compare two funds?
For money you put in once, the CAGR over the same dates, since it matches what the account did. For SIPs, XIRR does the same job across many dates. An average of yearly returns is useful for describing a typical year, not for comparing outcomes.
Can a fund with a lower average return beat one with a higher average?
Yes, if its returns swing less. In our model data for 2022 to 2025, the Nifty 50 Equal Weight model averaged 18.2 percent against 19.6 for the Healthcare Basket model, yet compounded at 17.8 against 15.6 (Model, back tested, as of 27 Apr 2026).
The cards
3 cards. Swipe, or tap to open.
Explore next
Learn it properly, then see it applied.
- GuideNifty 50 returns by year: every calendar year since 2013, and the falls inside themEvery calendar year since 2013 from NSE's closes, with the fall inside each year.
- Free module 2.3Risk Metrics That Matter8 min read
- StrategyAllcap strategyNifty Total Market, 50 stocks, every 2 weeks
- CalculatorLumpsum calculatorFree, with the formula and a worked example
Related
- Volatility drag: same average, six lakh gapTwo funds printing a 12 percent average return ended at Rs 28.4 lakh and Rs 21.8 lakh on the same Rs 10 lakh, because the drag scales with volatility squared.Returns and risk maths . . 6 min
- The volatility taxFive portfolios averaging 12 percent compound at 11.98 down to 4.00 percent depending only on volatility, so Rs 10 lakh over twenty years ends anywhere from Rs 96 lakh to Rs 22 lakh.Returns and risk maths . . 9 min
- The average return is a liePlus 30, minus 20, plus 25, minus 15 averages 5.00 percent and compounds at 2.53, and a 12 percent average at 45 percent volatility compounds at 3.93.Returns and risk maths . . 13 min
Educational content only. Figures are illustrative and computed on historical or representative data for teaching purposes, not investment advice. Past performance does not guarantee future returns. Sourced from NSE, BSE, SEBI, AMFI and RBI public data.