

Returns and risk maths..5 min read
The long run makes the rate safe and the rupees wild
Twenty years narrows the annualised range to about 6 to 15 percent while the rupee outcome on Rs 10 lakh fans out from Rs 31 lakh to Rs 1.56 crore.
By Tanmay Kurtkoti, founder of QC Alpha and builder of RupeeCase
A friend told me over chai he had stopped checking the volatility number on his funds. Twenty year horizon, he said. Stocks are safe in the long run, everyone knows that. I told him he was half right, and the half he was skipping was the one that decides what he actually walks away with.
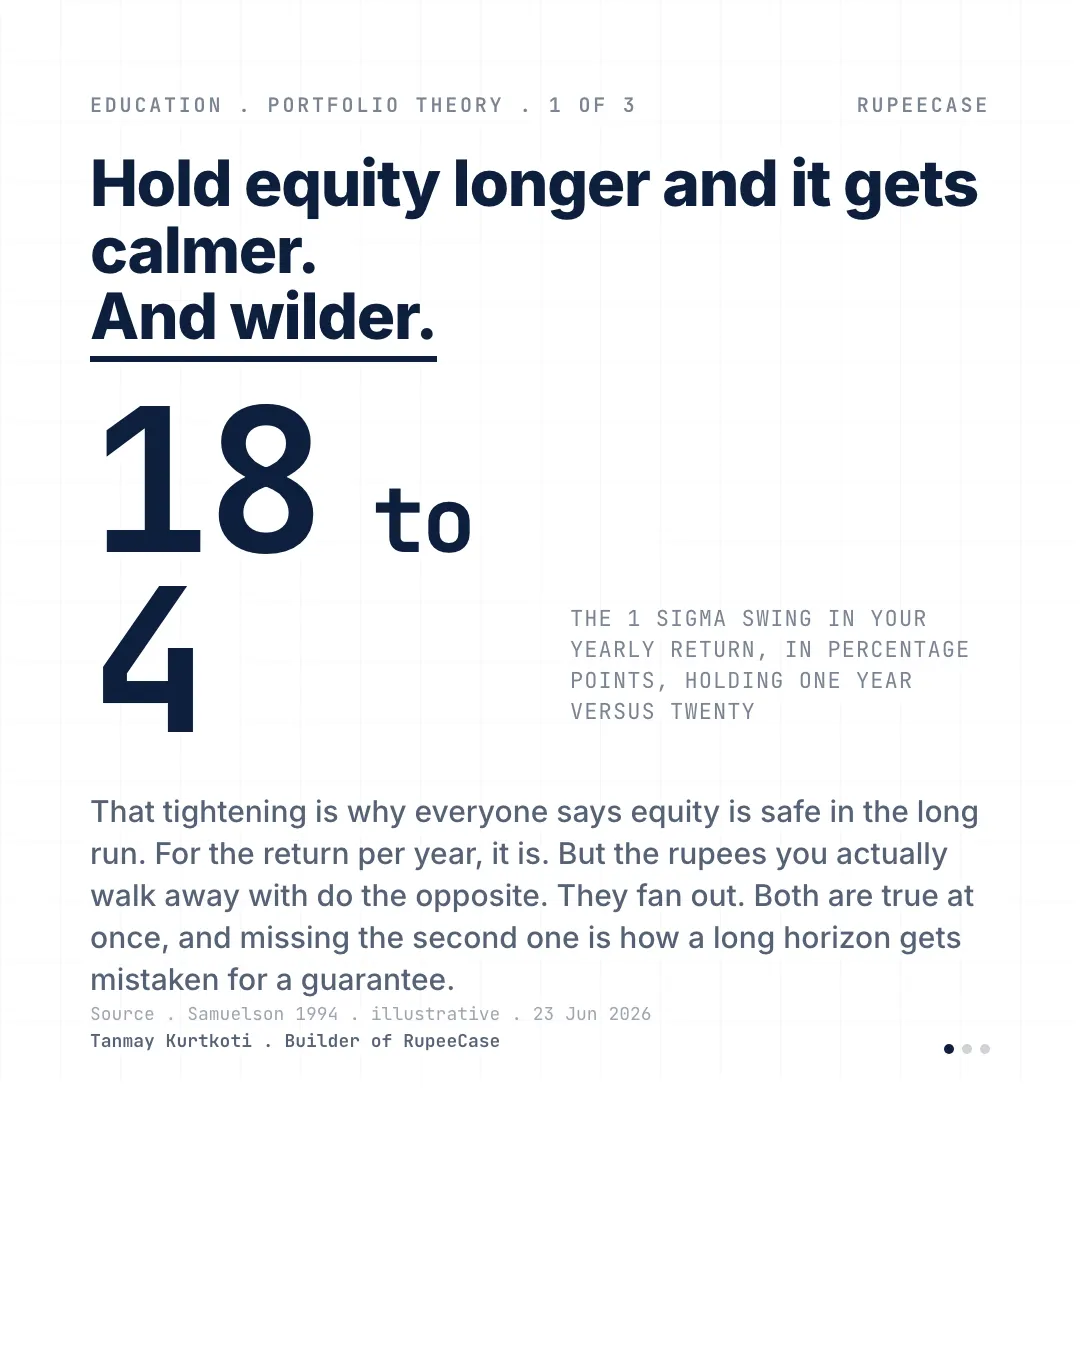
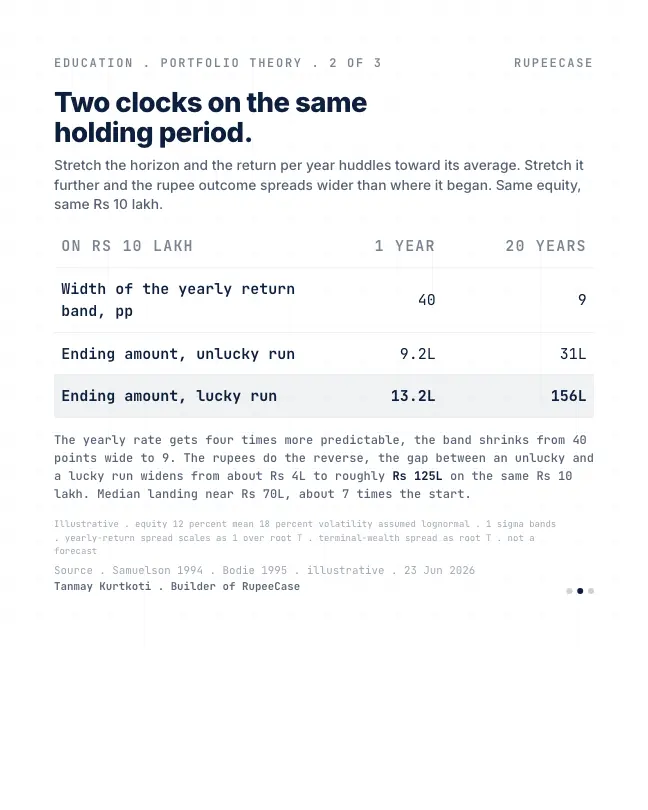
Here is the half he had. Hold equity for one year and the return is a coin in the air, anywhere from down 8 percent to up 32. Hold it for twenty and the annualized number settles into a much tighter range, somewhere around 6 to 15. The swing per year, in plain terms, gets about four times more predictable. That is genuinely true, and it is the reason the long-run line sounds so reassuring.
Here is the half he was missing. The rate calming down is not the same as the outcome calming down. Run the same Rs 10 lakh forward. Over one year it lands between roughly 9.2 lakh and 13.2 lakh, a gap of about 4 lakh. Over twenty years that band runs from about 31 lakh to 1.56 crore. The percentage huddled toward its average. The rupees did the exact opposite and fanned out to a 1.25 crore spread on the same starting cheque.
Two clocks run on one holding period. One says the rate gets more certain with time. The other says the amount gets less certain. They are both correct, and people quote only the first.
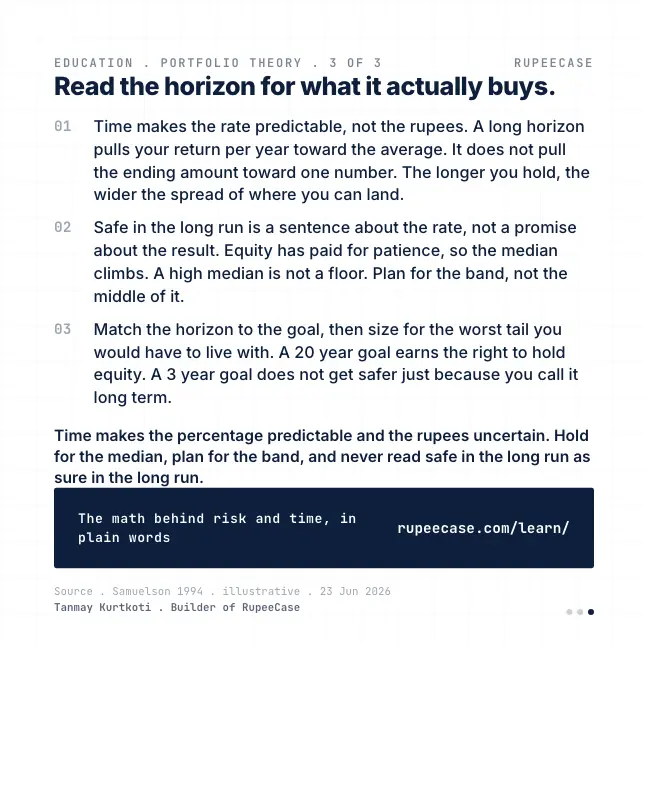
What I told my friend was simple. A long horizon earns you the equity premium, so the median outcome does climb, and that is worth a lot. But a high median is not a floor. The band does not shrink to a single number just because you waited. So match the horizon to the goal, hold for that median, and size the position for the worst tail you would actually have to live through.
The math in plain words
Here is the model behind the numbers, so you can rebuild them. Assume equity compounds at a typical 10.5 percent a year, with a yearly swing (standard deviation) of 20 percent. Both are round illustration figures, not a forecast.
The swing of the yearly average shrinks with the square root of time. Over one year the one standard deviation band is 10.5 plus or minus 20, so about minus 9.5 to plus 30.5 percent. Over twenty years it is 10.5 plus or minus 20 divided by the square root of 20, which is 4.47. That gives about 6.0 to 15.0 percent a year. Roughly two outcomes in three land inside that band.
Now turn those rates into rupees. Rs 10,00,000 x 1.060 ^ 20 is about Rs 32 lakh. Rs 10,00,000 x 1.150 ^ 20 is about Rs 1.63 crore. The rate band narrowed from 40 points to 9. The rupee band widened from Rs 4 lakh to about Rs 1.3 crore.
Move the horizon yourself
Set the years to 1, then 5, then 10, then 20. Here is what you will see.
- 1 yearRs 4.0 L
- 5 yearsRs 13.5 L
- 10 yearsRs 32.3 L
- 20 yearsRs 130.6 L
Gap between the low and high outcome on Rs 10 lakh, 10.5 percent typical return, 20 percent swing. Illustration from the calculator above.
The same pattern in real monthly data
The square root rule is a model. So I checked the narrowing half on our own model curves, using every rolling window from Jul 2021 to Jul 2026.
Nifty 50 EW model: point range, any 12 months: minus 4 to plus 54 percent
Model, back tested, as of 27 Apr 2026
Same model: point range, any 36 months a year: 15.5 to 27 percent
Model, back tested, as of 27 Apr 2026
Over any 12 months the Nifty 50 Equal Weight model returned between about minus 4 and plus 54 percent. Over any 36 months, annualised, the range tightened to about 16 to 27 percent a year. The rate calmed down, exactly as the first clock says. Five years of data is short, and the windows overlap, so treat this as a picture of the pattern, not a measure of it.
The second clock shows up as soon as you multiply. On Rs 10 lakh, three years at 16 percent is about Rs 15.6 lakh. Three years at 27 percent is about Rs 20.5 lakh. A narrower rate band on paper, and still a Rs 5 lakh question in rupees.
The free Learn module on risk management covers drawdown, position sizing and how to plan for the bad end of a range, with quizzes and a certificate. Related reading: what a fixed deposit really earns after tax and inflation and average return against CAGR.
Questions readers ask
Is equity risk free over the long term?
No. Over long periods the yearly rate tends to settle into a narrower range, but the rupee outcome spreads wider, because small differences in the rate compound for longer. With the illustration in this post, twenty years on Rs 10 lakh spans roughly Rs 32 lakh to Rs 1.63 crore.
What is time diversification?
It is the idea that holding risky assets for longer reduces risk. It is true for the annualised rate, which varies less over longer windows. It is not true for the final amount, which is what most goals depend on.
How should a long horizon change how I plan?
It raises the middle outcome, which is a real benefit. A plan still has to work if the result lands near the low end of the range. That is why goal size, time and the worst plausible outcome are planned together.
The cards
3 cards. Swipe, or tap to open.
Explore next
Learn it properly, then see it applied.
Related
- After tax and inflation, safe can go backwardsA 7 percent fixed deposit nets about 4.9 after top slab tax and roughly zero after 5 percent inflation, so Rs 10 lakh that doubled on paper buys less than it did.Returns and risk maths . . 5 min
- Average return vs CAGRUp 50 then down 50 averages zero and loses a quarter of the money, and two funds averaging 12 percent at 8 and 30 percent volatility end twenty years at Rs 91 lakh and Rs 42 lakh.Returns and risk maths . . 5 min
- TRI vs price index: which NiftyThe total return index runs about 1.3 points a year hotter than the TV number, enough to turn a fund that beat the price index by Rs 2.89 lakh into one that trailed by Rs 0.91 lakh.Returns and risk maths . . 5 min
Educational content only. Figures are illustrative and computed on historical or representative data for teaching purposes, not investment advice. Past performance does not guarantee future returns. Sourced from NSE, BSE, SEBI, AMFI and RBI public data.