

Portfolio construction..5 min read
The optimizer is an error maximizer
One point of forecast error moved eighty points of portfolio weight in a three stock demo, which is why DeMiguel, Garlappi and Uppal found equal weight hard to beat out of sample.
By Tanmay Kurtkoti, founder of QC Alpha and builder of RupeeCase
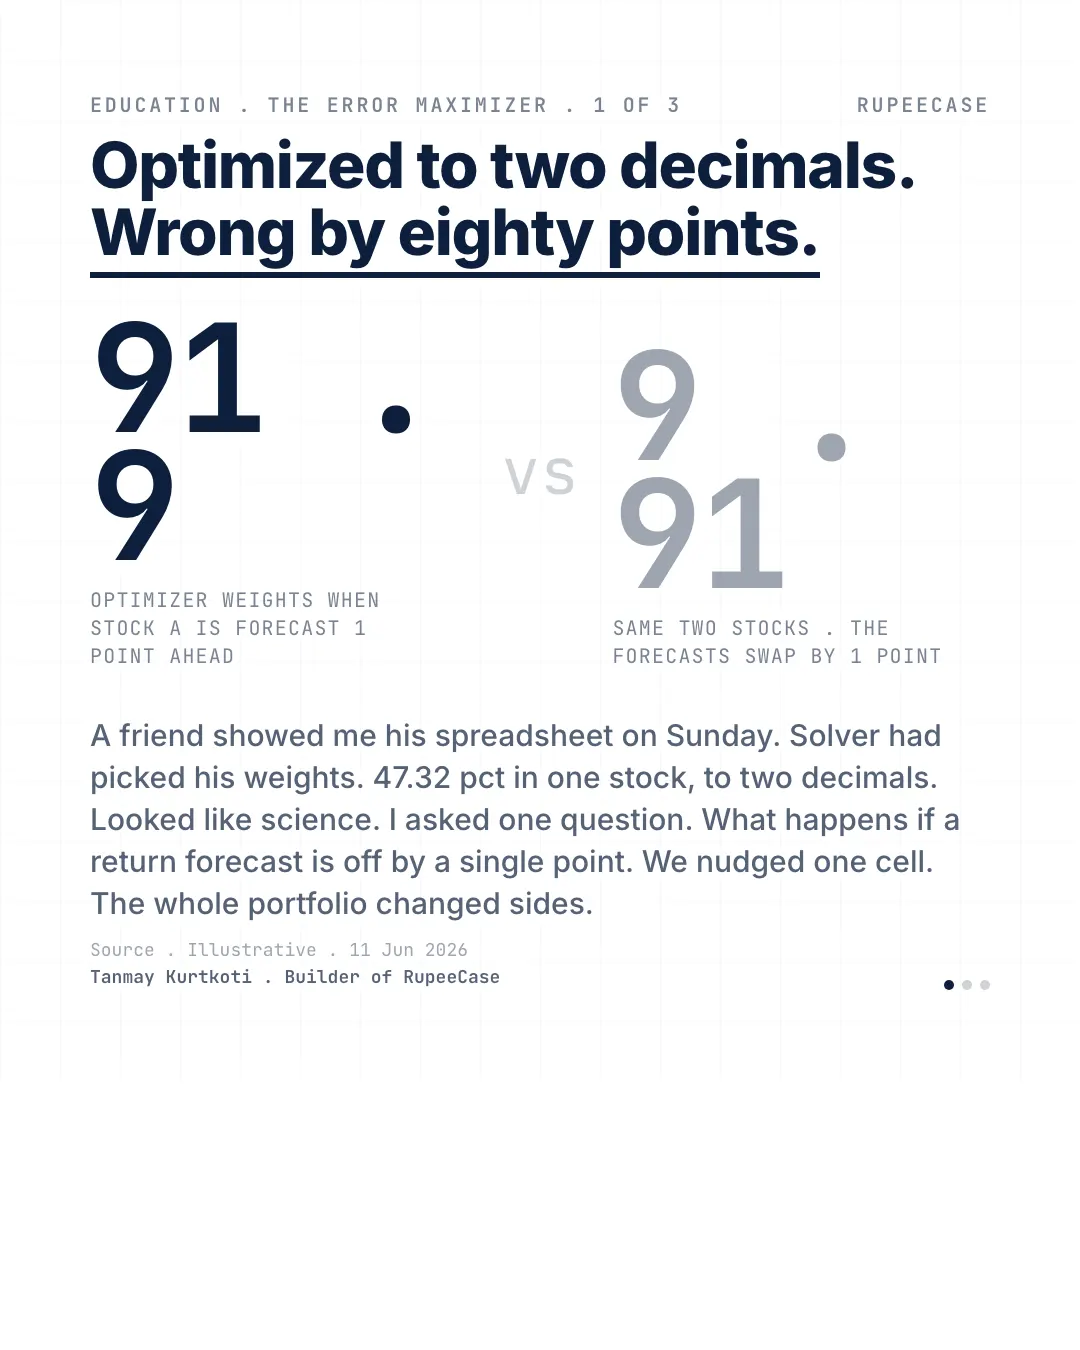
A friend showed me his portfolio spreadsheet on Sunday. He had run Solver on five years of returns and it handed back weights to two decimal places. 47.32 pct in one stock. It looked like science.
I asked one question. What happens if a return forecast is off by one point.
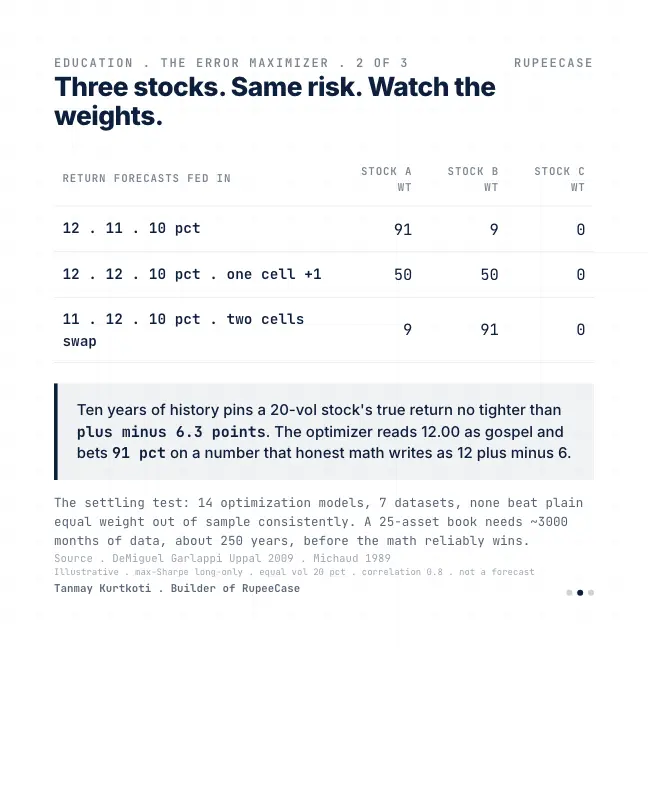
We ran a clean demo. Three stocks, same volatility, correlation 0.8. Feed in forecasts of 12, 11 and 10 pct and the optimizer puts 91 pct in the first stock. Nudge the second forecast up by a single point and it splits 50/50. Swap two forecasts and the book flips to 9/91. One point of input error moved eighty points of portfolio.
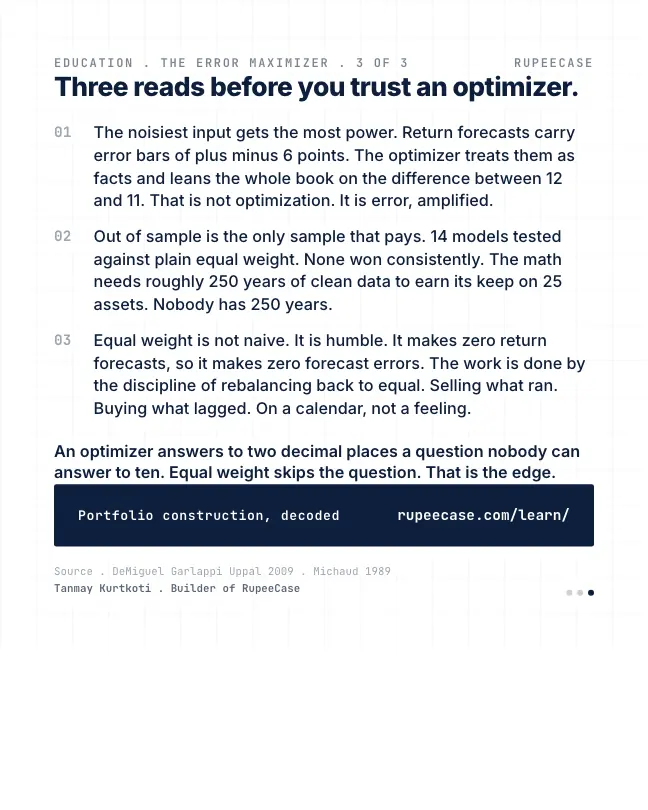
Here's the part most people miss. Return forecasts are the noisiest number in finance. Ten years of history pins a 20-vol stock's true return no tighter than plus minus 6.3 points. The optimizer reads 12.00 as gospel and leans the whole book on the difference between 12 and 11. Richard Michaud named the bug back in 1989: the optimizer is an error maximizer. It loads up on exactly the assets whose returns were overestimated.
The test that settles it came in 2009. DeMiguel, Garlappi and Uppal ran 14 optimization models across 7 datasets against plain equal weight. None won out of sample consistently. For a 25-asset book the math needs roughly 3000 months of clean data, about 250 years, before it reliably earns its keep.
Equal weight makes zero forecasts, so it makes zero forecast errors. The work is done by the discipline of rebalancing back to equal. Selling what ran. Buying what lagged. On a calendar, not a feeling.
An optimizer answers to two decimal places a question nobody can answer to ten. Equal weight skips the question. That is the edge.
One point in, eighty points out
The demo in the opening, drawn as three outcomes. Same stocks, same risk, same correlation. Only the return forecasts change, by a point or two, and the weight in the first stock swings from almost all to almost nothing.
- Forecasts 12, 11, 1091%
- Forecasts 12, 12, 1050%
- Two forecasts swapped9%
Weight in the first stock. Worked example from the original post of 11 Jun 2026: three stocks, equal volatility, correlation 0.8.
The reason is the high correlation. When three stocks move together, the optimizer sees them as near copies, and it piles into whichever copy has the slightly higher forecast. The tiny difference in forecasts is the only thing separating them, so the tiny difference decides everything.
How tight is a return estimate, really?
The error band on an average return shrinks with the square root of the years of data. The standard error is the volatility divided by the square root of the number of years. A stock with 20 percent volatility and ten years of history: 20 divided by the square root of 10, about 6.3 points. That is the figure in the opening.
To know a 20 percent volatility stock's average return to within one point, you need about 400 years of data. No stock has that. No market has that in a stable form. So the forecasts that feed the optimizer are guesses with a wide blur, and the optimizer treats the blur as precision.
Now apply it to a real index. The Nifty 50's daily returns had an annualised volatility of about 13.5 percent over the year to 30 Sep 2026, by NSE closing data. Even for the calmest broad index in India, one year of data pins its average return to within about plus or minus 13 points. The index fell 8.1 percent over that year. A forecast built on that year would be useless for next year.
What equal weight gives up and what it keeps
MythWeights to two decimal places mean the optimizer knows something.
FactThe decimals come from the inputs, and the inputs carry a blur of several points. The precision is arithmetic, not knowledge.
MythEqual weight is what you use when you have no view.
FactEqual weight is a view: that return forecasts are too noisy to bet on. On that view, the best weights are the ones that make no forecast at all.
RupeeCase runs this idea on the Nifty 50 universe: all 50 names at equal weight, rebalanced every four weeks. In the model the Nifty 50 Equal Weight card compounded at 16.35 percent a year with a maximum drawdown of 15.71 percent and a Sharpe ratio of 1.13 (Model, back tested, as of 27 Apr 2026). It is the simplest card on the lineup, and the rule never asks anyone to forecast a return.
Equal weight is not free of judgment. It still needs a universe chosen with care, a rebalance cadence and an honest cost model. Those are decisions about process, not about which stock will earn 12 versus 11 next year. The Nifty 50 is 10 stocks plus 40 footnotes shows the same rule from the concentration side.
The free Learn module on modern portfolio theory covers the optimizer, the frontier and the estimation error that undoes both, with a quiz and a certificate. The Sharpe and volatility calculator shows risk adjusted return for any set of figures.
Questions readers ask
Why do mean variance optimizers give extreme weights?
Because they treat return forecasts as exact. When assets are highly correlated, a small difference in forecasts looks like a large opportunity, so the optimizer concentrates heavily in whichever asset has the slightly higher, and often overestimated, forecast.
Is equal weighting better than optimization?
Out of sample, equal weight has been hard to beat in published tests, because it makes no return forecasts and so cannot be misled by forecast errors. Optimizers can do better only with far more reliable inputs than real data usually provides.
How many years of data do you need to estimate stock returns?
For a stock with 20 percent volatility, ten years of data still leaves a standard error of about 6.3 points on the average return. Pinning it to within one point would take about 400 years.
The cards
3 cards. Swipe, or tap to open.
Explore next
Learn it properly, then see it applied.
- StrategyAllcap strategyNifty Total Market, 50 stocks, every 2 weeks
- CalculatorAsset allocation by risk profileFree, with the formula and a worked example
- Free module 4.1Modern Portfolio Theory, What Actually Matters11 min read
- CalculatorSharpe and volatilityFree, with the formula and a worked example
- Blog topicPortfolio construction notes33 notes
Related
- The Nifty 50 is 10 stocks plus 40 footnotesThree stocks are 30 percent of the Nifty 50 and the top ten cross 58 percent, so a cap weighted index fund is far more concentrated than the word diversified suggests.Portfolio construction . . 6 min
- 60/40 is a 94/6 bet with better brandingAt 18 percent equity volatility and 5 percent debt volatility, a 60/40 book carries 94 percent of its risk in equity, and a true risk split needs about 22/78.Portfolio construction . . 4 min
- Capital weight is not risk weightA 60/40 portfolio's risk decomposes to about 95/5, and genuinely splitting risk down the middle takes roughly 22 percent in stocks and a 6 percent annual swing.Portfolio construction . . 4 min
Educational content only. Figures are illustrative and computed on historical or representative data for teaching purposes, not investment advice. Past performance does not guarantee future returns. Sourced from NSE, BSE, SEBI, AMFI and RBI public data.