

Company numbers..5 min read
Same net profit, two different quarters
Two companies printing Rs 245 crore of net profit collected Rs 220 crore and Rs 38 crore of operating cash, and the accruals gap is the line that does not negotiate.
By Tanmay Kurtkoti, founder of QC Alpha and builder of RupeeCase
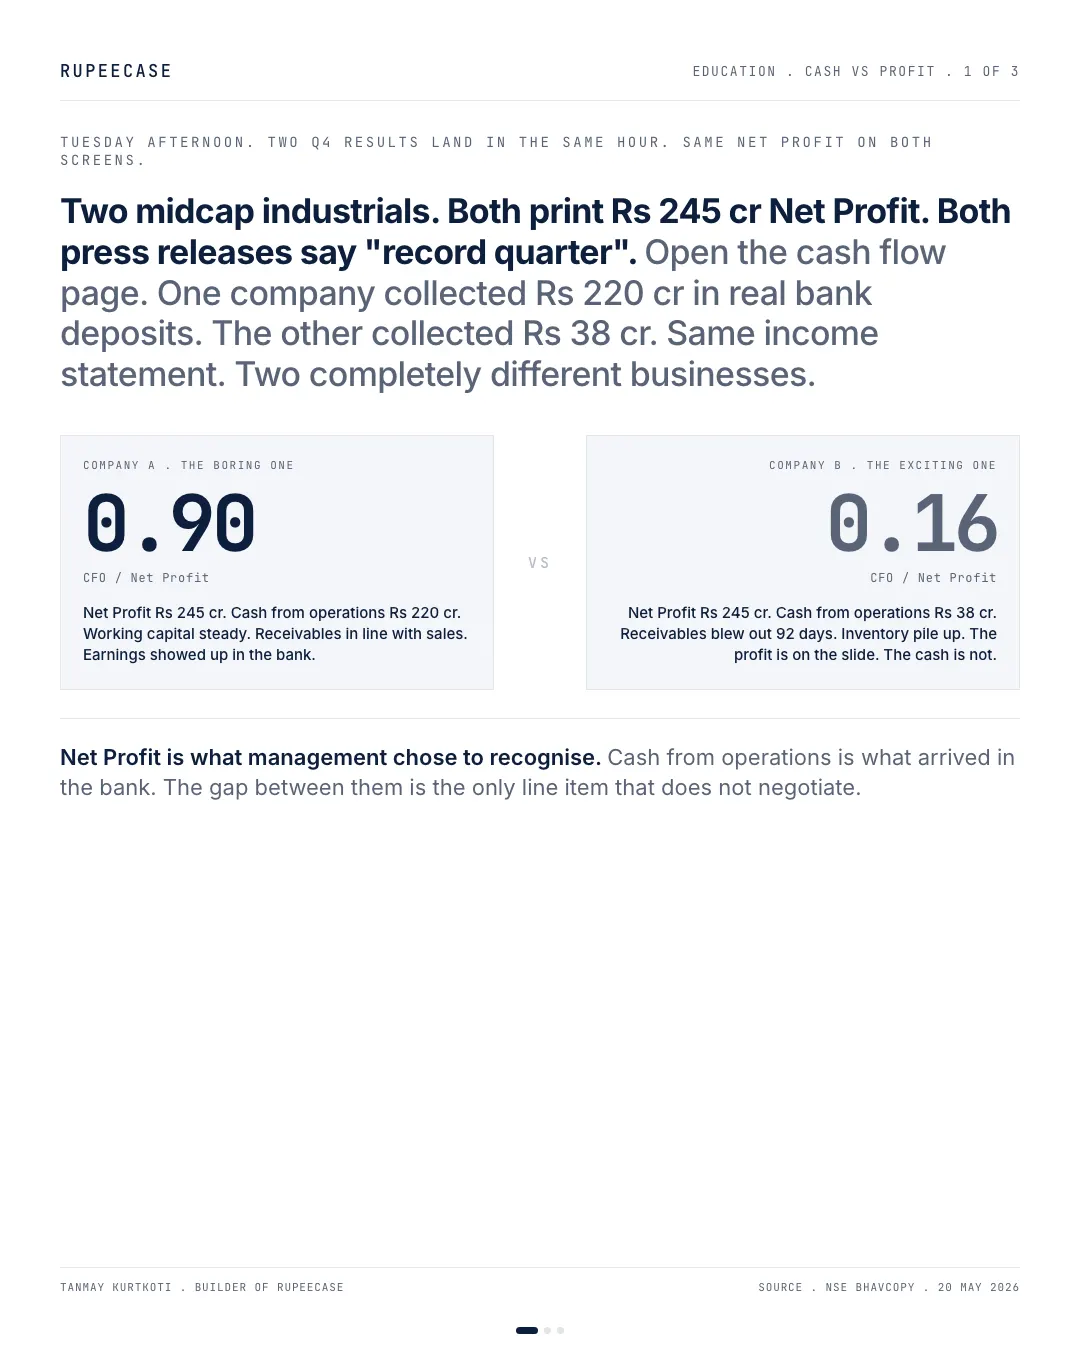
Tuesday afternoon at the desk. Two Q4 results land in the same hour. Two midcap industrials. Both print Net Profit of Rs 245 cr. Both press releases say "record quarter". Both stocks open green the next day.
Then you open the cash flow page on each.
Company A collected Rs 220 cr of real bank deposits against that Rs 245 cr Net Profit. Cash conversion ratio 0.90. Working capital steady. Receivables in line with sales. Earnings showed up in the bank. Boring. Clean. The kind of quarter you can compound.
Company B collected Rs 38 cr against the same Rs 245 cr Net Profit. Cash conversion 0.16. Receivables blew out by 92 days. Inventory pile up across two warehouses. The profit is on the slide. The cash is on the customer's terms. Same income statement headline. Two completely different businesses.
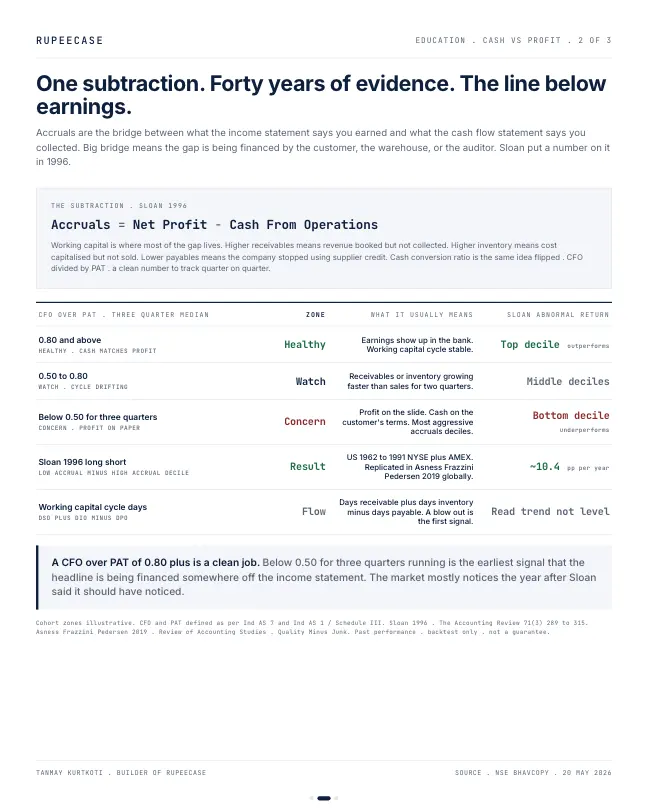
Net Profit is what management chose to recognise. Cash From Operations is what arrived in the bank. The gap between them, what accountants call accruals, is the only line item that does not negotiate.
Sloan put a number on this in 1996. Sorted US listed companies into deciles by total accruals (Net Profit minus Cash From Operations). Bought the lowest decile. Shorted the highest. Earned roughly 10.4 percentage points per year of abnormal return through to 1991. Replicated globally inside the Quality Minus Junk factor framework (Asness Frazzini Pedersen 2019).
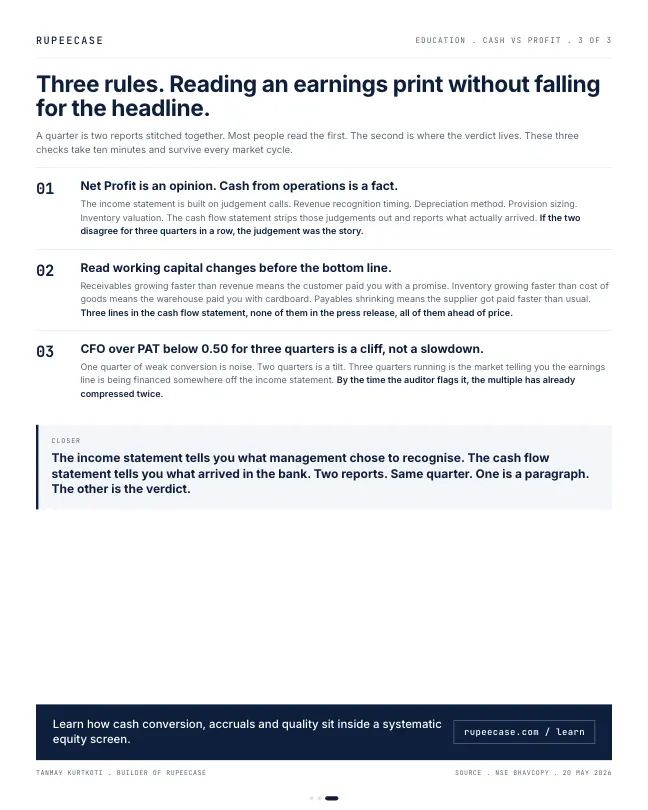
Three zones to file. Above 0.80 over three quarters is healthy. 0.50 to 0.80 is the watch shelf. Below 0.50 for three quarters running is a cliff, not a slowdown, because by the time the auditor flags it the multiple has already compressed twice.
Two reports. Same quarter. One is a paragraph. The other is the verdict
Where Rs 207 crore went missing
Cash conversion is one division. Cash from operations divided by net profit. For Company A, Rs 220 crore over Rs 245 crore is 0.90. For Company B, Rs 38 crore over Rs 245 crore is 0.16. The accruals are the difference: Rs 25 crore for A, Rs 207 crore for B.
Company A: Rs 220 crore cash on Rs 245 crore profit
Worked example, not a company
Company B: Rs 38 crore cash on the same profit
Worked example, not a company
The number tells you that something is wrong. The bridge tells you what. Every cash flow statement prepared the indirect way starts at profit and walks to cash, one line at a time. Here is Company B's walk for the quarter, with figures chosen to match the opening.
Start with net profit of Rs 245 crore. Add back depreciation of Rs 40 crore, because it is a cost on paper that did not leave the bank this quarter. That gives Rs 285 crore. Now the working capital lines. Trade receivables went up by Rs 190 crore: goods were shipped and booked as sales, but customers have not paid. Inventory went up by Rs 57 crore: cash was spent making goods that are sitting in the two warehouses. Rs 285 crore less Rs 190 crore less Rs 57 crore is Rs 38 crore. That is the cash from operations.
- Net profit245
- Add back depreciation+40
- Rise in receivables-190
- Rise in inventory-57
- Cash from operations38
Rs crore, one quarter. Worked example, not a company.
Company A's walk uses the same first two lines. Rs 285 crore, less Rs 40 crore of new receivables and Rs 25 crore of new inventory, is Rs 220 crore. A growing business always ties up some cash in working capital. The question is how much, and whether it keeps getting bigger.
Redo it with your own numbers
The three inputs you need are all on the cash flow statement of any listed company's annual report or half yearly filing on NSE or BSE. Profit, the non cash add backs, and the change in working capital.
A real cash flow statement has more lines than this: tax paid, changes in payables, provisions, interest. The simplification keeps the two lines that move most often in a bad quarter. If you want the full statement walked line by line, the free Learn module on revenue quality and earnings quality does it with a cash conversion calculator and a quiz.
Why one quarter is not enough
A single weak quarter can be honest. A big order shipped on 28 March will sit in receivables on 31 March and arrive as cash in April. That is why the zones in the opening use three quarters, or better, the full year.
Here is how the two companies might look across three quarters in a row. Company A at 0.92, 0.88 and 0.90: steady. Company B at 0.71, 0.44 and 0.16: each quarter worse than the last. The first figure is on the watch shelf. By the third, the trend is the story.
MythA record profit means the company had a record quarter for cash.
FactProfit is booked when goods are invoiced. Cash arrives when customers pay. Company B booked Rs 245 crore of profit and collected Rs 38 crore of operating cash in the same quarter.
Two things make the gap worse in a growing midcap. Sales booked to distributors at the end of a quarter, which inflate receivables. And inventory built ahead of demand that may not come. Both show up on the balance sheet before they show up in profit. Which is why the post on earnings quality in five lines reads receivable days before it reads the headline, and the post on the working capital cycle shows how many days of cash a business really needs.
Questions readers ask
What is a good cash conversion ratio?
Cash from operations divided by net profit above 0.80, averaged over three quarters or a full year, is a common healthy range. Between 0.50 and 0.80 is worth watching. Below 0.50 for several quarters in a row means a large part of reported profit is not turning into cash.
Where do I find cash from operations for an Indian company?
It is in the cash flow statement, published with the annual report and with the half yearly results filed on NSE and BSE. Look for the line called net cash generated from operating activities. Quarterly results usually carry only the profit and loss, so the cash check is easiest on half years and full years.
Is low cash conversion always a red flag?
Not always. A company growing fast, or one that shipped a large order just before the quarter end, can show low conversion for a quarter and catch up in the next. The warning sign is a ratio that falls quarter after quarter while receivable days keep rising.
The cards
3 cards. Swipe, or tap to open.
Related
- EPS grew, cash did notEarnings per share rising from 10 to 17 while free cash flow sits at 9 drops the conversion ratio from 0.90 to 0.53, and three quarters of that is a trend, not timing.Company numbers . . 5 min
- Five lines below the headlineA land sale, a deferred tax write back and a stretched depreciation life turned 3.8 percent profit growth into a 25 percent headline, and receivable days cracked first.Company numbers . . 5 min
- The business that grows on its suppliers' moneyA 135 day cash conversion cycle needs Rs 37 crore to fund Rs 100 crore of extra sales, while a minus 35 day cycle is handed about Rs 10 crore for the same growth.Company numbers . . 5 min
Educational content only. Figures are illustrative and computed on historical or representative data for teaching purposes, not investment advice. Past performance does not guarantee future returns. Sourced from NSE, BSE, SEBI, AMFI and RBI public data.