

Behaviour..5 min read
FII flow: signal or noise
The day FII turned buyer and DII turned seller the Nifty slipped 0.14 percent, because a flow print is a record of yesterday and never a verdict on tomorrow.
By Tanmay Kurtkoti, founder of QC Alpha and builder of RupeeCase
Tuesday close. Three numbers on the desk.
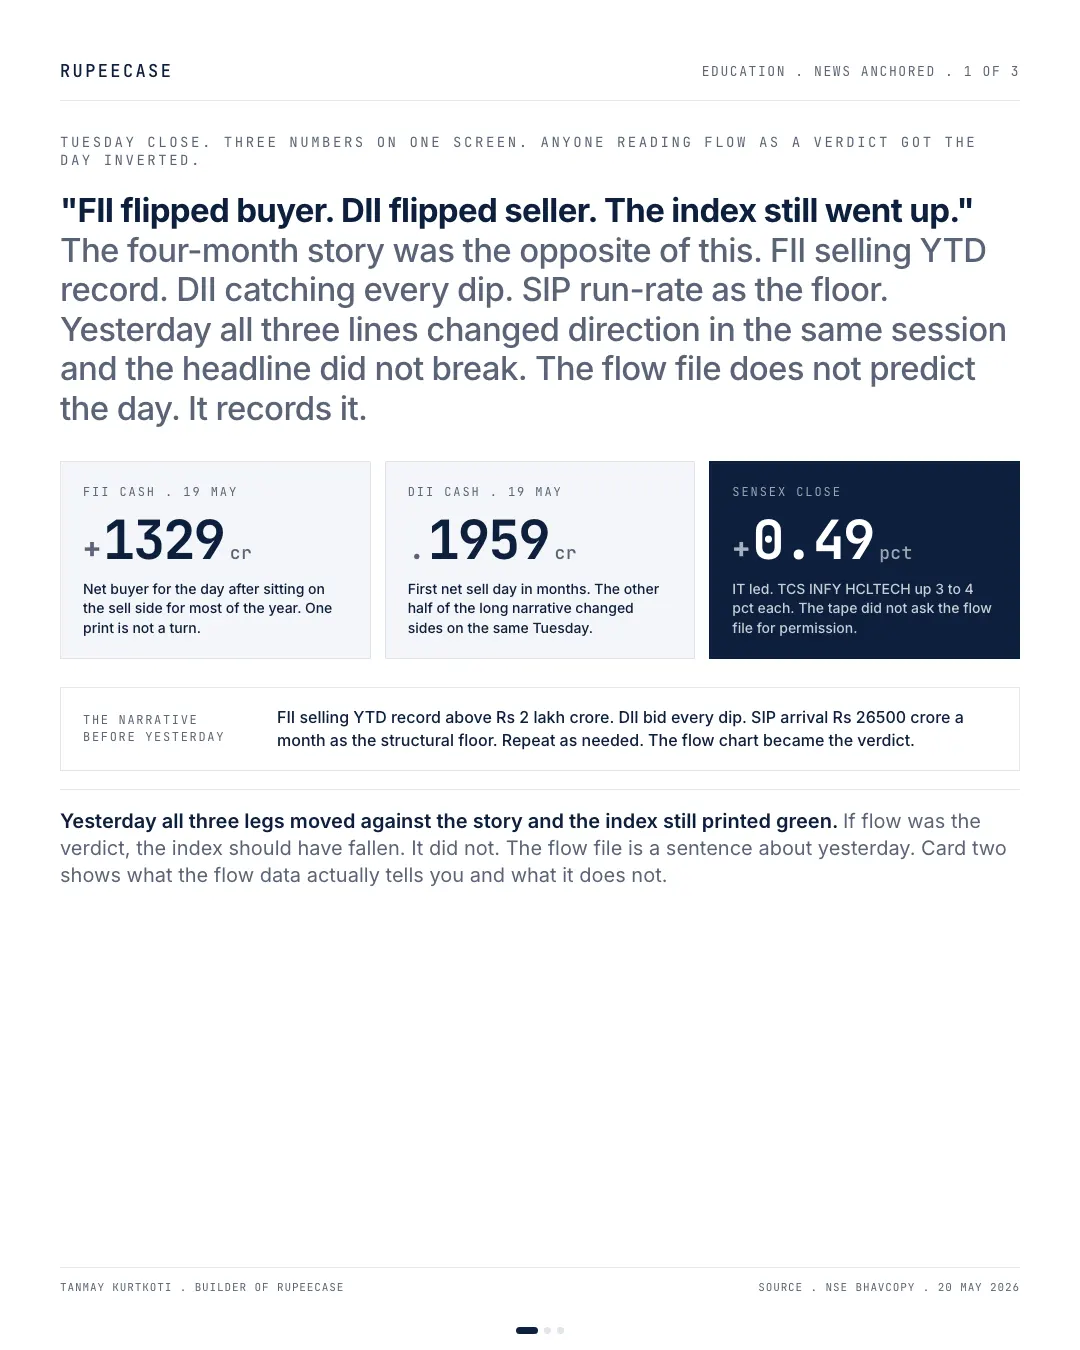
FII net buyer plus Rs 1,329 cr. DII net seller minus Rs 1,959 cr. Nifty 50 down 0.14 pct on NSE's close, 23,618.00 against 23,649.95 on Monday. The four month narrative was clean before yesterday. FII selling YTD record. DII catching every dip. SIP arrival as the floor. Repeat as needed. The flow chart had become the verdict.
Yesterday the legs moved against the story. Foreign money bought, domestic money sold. If flow was the verdict, the index should have risen. It slipped instead.
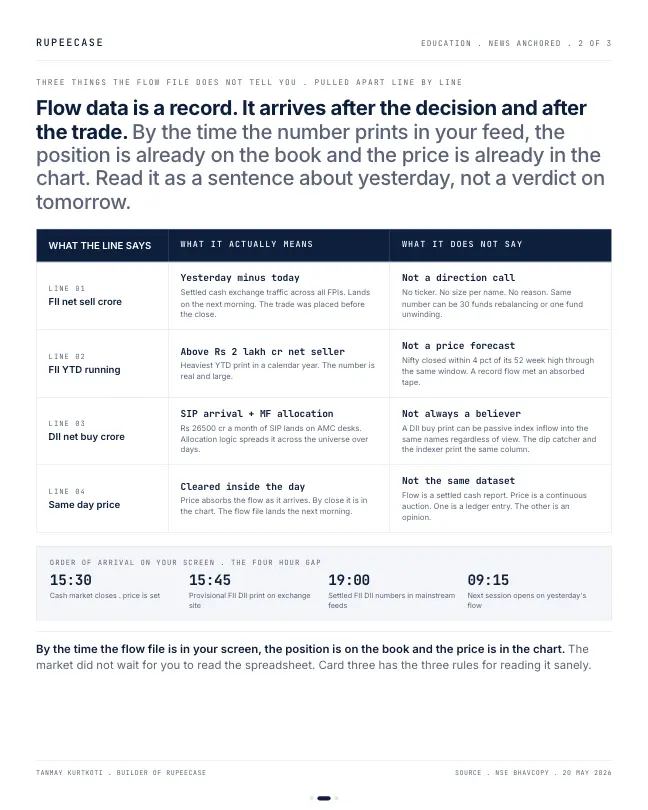
The lesson is the one the flow data has always taught and almost nobody actually internalises. It is a record, not a forecast. It lands after the decision and after the trade. By the time you read the print on your screen, the position is on the book and the price is in the chart. The cash market closes at 15:30. The provisional FII DII number is on the exchange site by 15:45. The settled number hits mainstream feeds around 19:00. The next session opens at 09:15. The flow file is a sentence about yesterday by the time anyone reads it. Sometimes a useful sentence. Never a verdict on tomorrow.
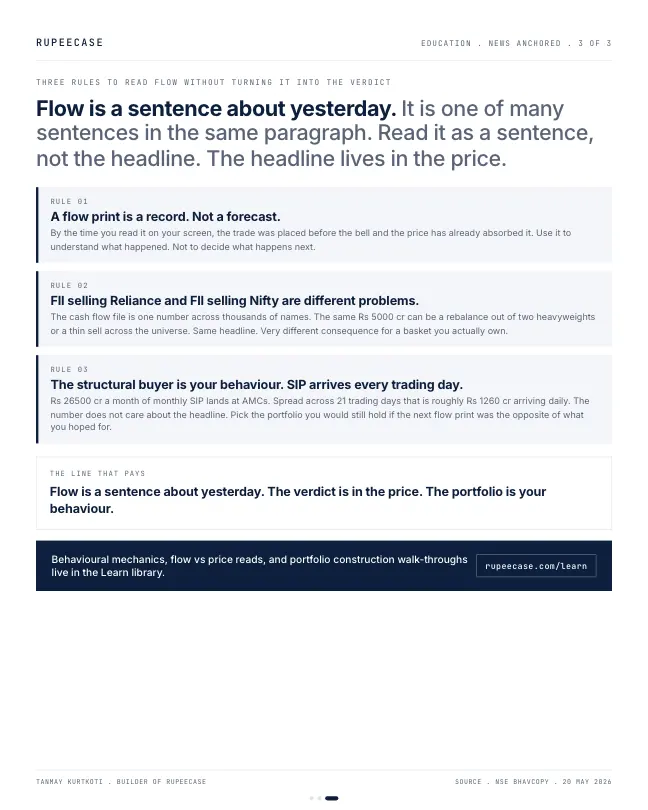
Three things to hold while you read it. A flow print is a record, not a forecast. Use it to understand what happened, not to decide what happens next. FII selling Reliance and FII selling Nifty are two different problems. The line is one number across thousands of names. The same minus Rs 5,000 cr can be a rebalance out of two heavyweights or a thin trim across the universe. And the structural buyer is your behaviour. Rs 26,500 cr a month of SIP lands at AMCs. Spread across 21 trading days that is roughly Rs 1,260 cr arriving daily. The number does not care about the headline.
Flow is a sentence about yesterday. The verdict is in the price. The portfolio is your behaviour.
A flow print, hour by hour
The order of events is the whole argument. By the time the flow number exists, the prices it describes are already fixed. Here is one ordinary trading day and the night after it.
- Cash market opens
Foreign and domestic orders meet in the same order book on NSE and BSE.
- Close
Every price for the day is now final. Nothing printed later can change it.
- Provisional FII and DII figures
One net number for each side, across every stock they traded.
- Headlines
The number becomes a story about who is winning.
- New session
Today's prices form on today's orders, not on yesterday's totals.
Does yesterday tell you about today?
If flow were a forecast, the price it reports should at least say something about the next day. So I tested the price itself. I took NSE's daily closes of the Nifty 50 from 14 Oct 2024 to 9 Oct 2026, 493 trading days including the two Budget day sessions, and asked a plain question: after an up day, how often was the next day up?
of all days closed higher
NSE, Nifty 50, Oct 2024 to Oct 2026
of days after an up day closed higher
NSE, Nifty 50, Oct 2024 to Oct 2026
of days after a fall of over 1% closed higher
NSE, Nifty 50, 30 of 52 days
An up day was followed by another up day 51.5 percent of the time, against 48.3 percent for any day. That is three points away from a coin. The correlation between one day's return and the next was minus 0.02, which is as close to nothing as a market number gets. And after the 52 days that fell more than 1 percent, the next day closed higher 30 times. Yesterday's direction barely tells you today's. Yesterday's flow total, which only describes the same day's trading, cannot be expected to do better.
One number across thousands of names
The second rule in the opening is about what the number hides. FII net flow is one figure summed over every stock foreign investors traded. The same total can mean very different things for the index and for your holdings.
Rs 5,000 Cr out of two index giants
- Index weight falls with them
- Most other stocks barely touched
- A stock problem that shows up in the index
Rs 5,000 Cr across 300 names
- About Rs 17 Cr a stock
- Absorbed by normal daily trading
- Little visible effect anywhere
How big is the structural buyer now?
The opening used Rs 26,500 crore a month of SIP money. AMFI's latest figure is larger: Rs 32,297 crore collected through SIPs in Aug 2026. Across about 21 trading days that is roughly Rs 1,538 crore a session. You can set any flow headline against it.
A Rs 5,000 crore sale is a little over three sessions of SIP money. That is why record foreign selling in 2026 met a buyer each day, and why the index moved far less than the flow line suggested. The full ledger is in the companion post, flow is a sentence, not a verdict.
What I actually use the print for
I read the flow file the way I read a match report. It tells me what happened and who was busy. It can help explain why a set of large caps moved together on a given day. It does not go into any rule that decides what to hold tomorrow, because the test above says it has nothing to add to the price that is already on the screen.
The free Learn module on INR, FII flows and global linkages explains where foreign money comes from, how the rupee and the dollar feed into it, and why flows matter more for some stocks than for the index.
Questions readers ask
Does FII buying or selling predict the next day's market?
On the evidence of the price itself, yesterday tells you very little. On NSE's Nifty 50 closes from Oct 2024 to Oct 2026, an up day was followed by another up day 51.5 percent of the time, against 48.3 percent for any day, and the correlation between consecutive days was minus 0.02.
When are FII and DII figures released?
Provisional FII and DII cash market figures come out on the exchange website in the evening, after the 15:30 close. They summarise trades that are already done, so they describe that day rather than the next one.
How much SIP money comes in every day?
AMFI reported Rs 32,297 crore of SIP contributions in Aug 2026. Spread over about 21 trading days, that is roughly Rs 1,538 crore a session, although each fund deploys its cash on its own schedule.
The cards
3 cards. Swipe, or tap to open.
Explore next
Learn it properly, then see it applied.
Related
- FII flow is a sentence, not a verdictFII sold Rs 1.92 lakh crore of Indian equity in four months of 2026 while the Nifty sat 7.6 percent off its high, because DII and the SIP book were the bigger buyer.Behaviour . . 5 min
- Recency bias meets factor crowdingA model basket up 60 percent on a trailing return screen is a momentum tilt with a friendly name, and the same factor has lost 28, 21 and 19 percent in its three crashes.Behaviour . . 6 min
- Sunk cost: the first loss is the cheapestA 35 percent hole needs 54 percent to climb out, and a Rs 65,000 rump held flat for three years forgoes about Rs 30,000 against cutting and redeploying at the index.Behaviour . . 5 min
Educational content only. Figures are illustrative and computed on historical or representative data for teaching purposes, not investment advice. Past performance does not guarantee future returns. Sourced from NSE, BSE, SEBI, AMFI and RBI public data.