

Behaviour..6 min read
Recency bias meets factor crowding
A model basket up 60 percent on a trailing return screen is a momentum tilt with a friendly name, and the same factor has lost 28, 21 and 19 percent in its three crashes.
By Tanmay Kurtkoti, founder of QC Alpha and builder of RupeeCase
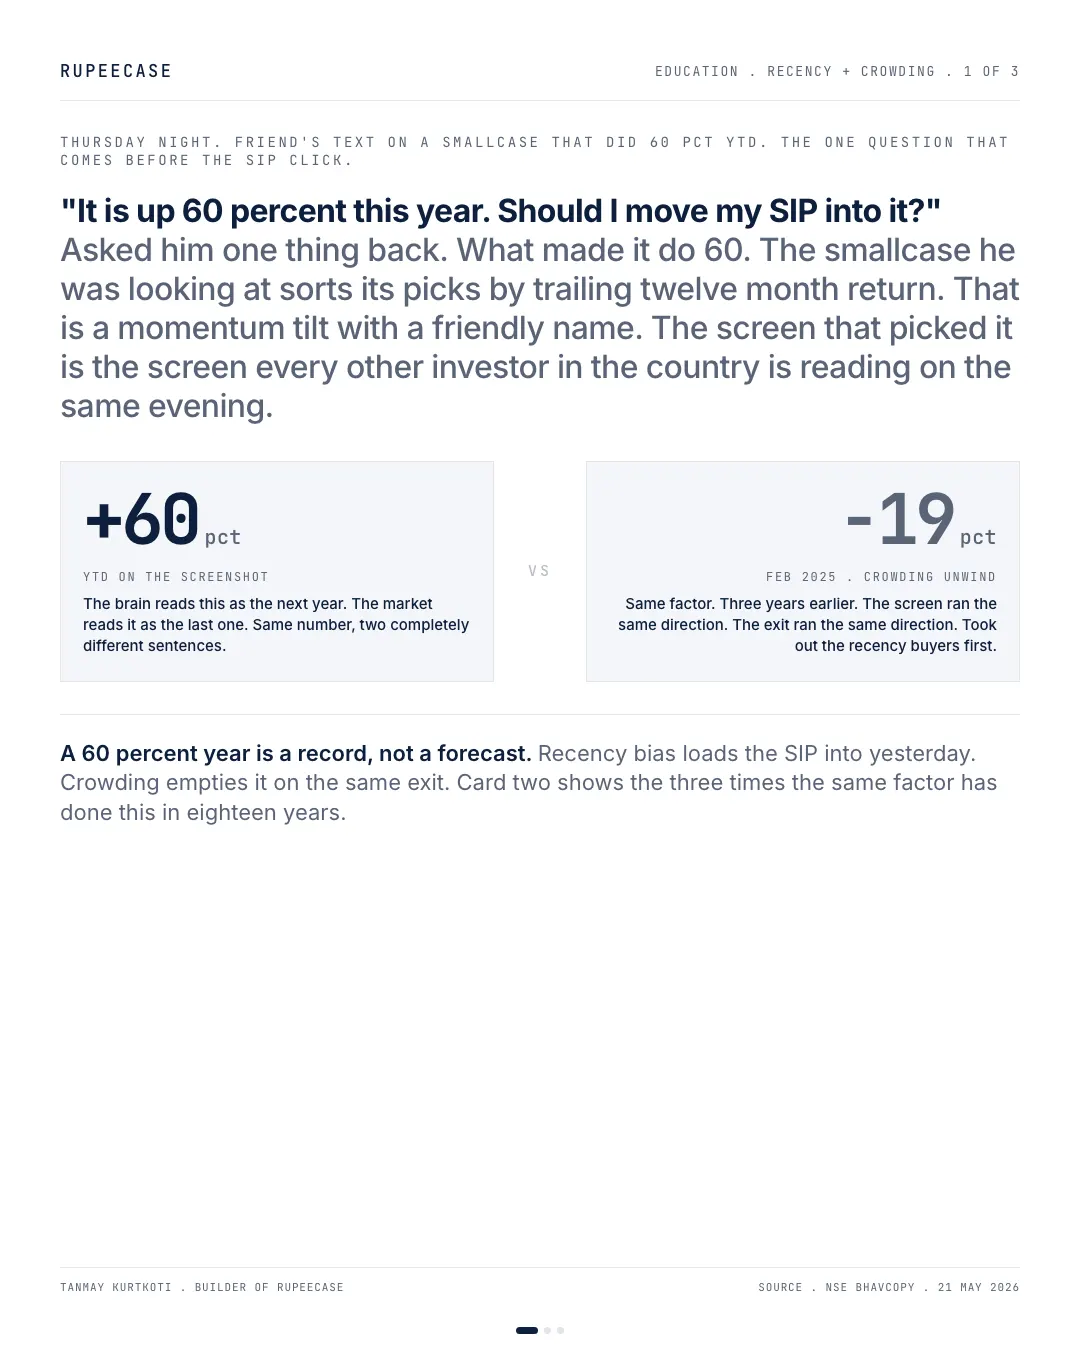
Thursday night. Friend texts a screenshot of a model basket up 60 percent YTD. "Should I move my SIP into this."
Asked him one thing back. What made it do 60.
The basket ranks its picks by trailing 12 month return. That is a momentum tilt with a friendly name. The screen that picked it is the screen every other investor in the same group chat is reading on the same evening. Once you can see the engine, the question stops being whether to chase the 60 percent and starts being whether you have done this before without realising.
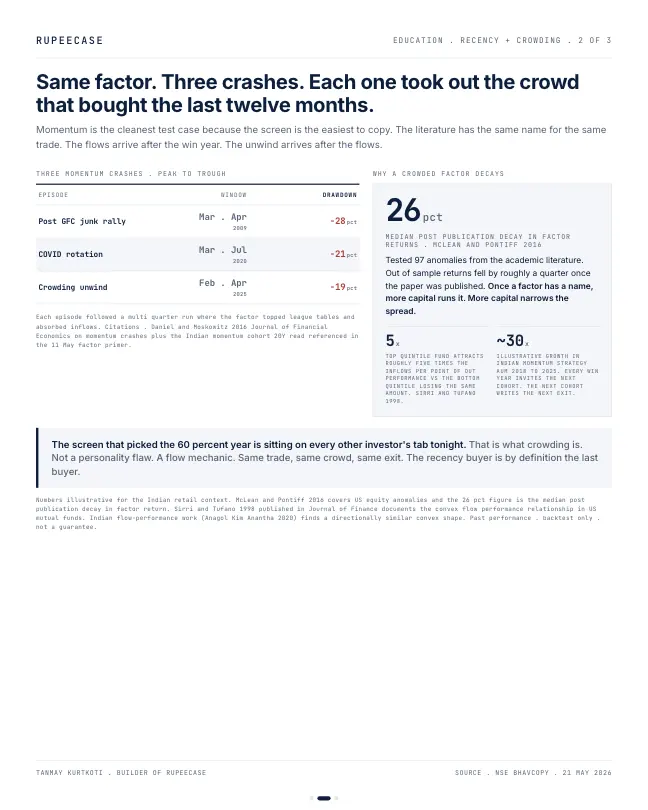
The factor has done it three times in eighteen years. Mar 2009 post GFC junk rally minus 28 percent. Mar 2020 COVID rotation minus 21 percent. Feb 2025 crowding unwind minus 19 percent. A 60 percent year is one tail of a distribution that also contains a minus 28. The brain treats it as the next year. The market treats it as the last one.
The mechanic underneath has a name. McLean and Pontiff 2016 ran 97 published anomalies out of sample after the academic paper landed. Median return fell 26 percent. Once a factor has a label, more capital runs it, more capital narrows the spread, and the SIP that arrived after the win year shows up in time to be the last buyer. Sirri and Tufano 1998 documented the flow asymmetry. Winners attract roughly five times the inflows per point of out performance vs losers shedding the same.
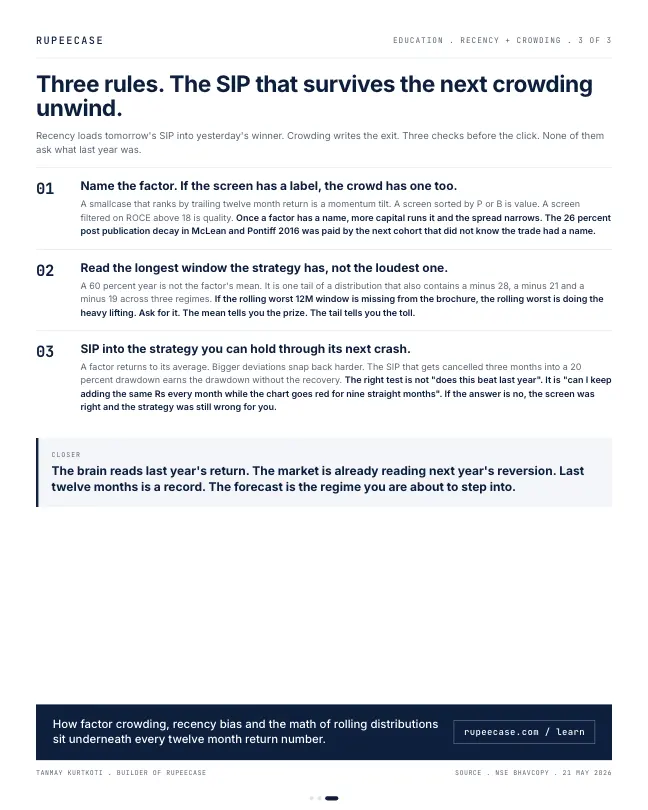
Three checks before the click. Name the factor, because if the screen has a label the crowd has one too. Read the rolling worst 12M window, not the loudest year, because the mean tells you the prize and the tail tells you the toll. SIP into the strategy you can hold while the chart goes red for nine straight months. The cancelled SIP earns the drawdown without the recovery.
The brain reads last year's return. The market is already reading next year's reversion.
What recency bias does to a return table
Recency bias is the habit of treating the latest observation as the most likely next one. A trailing 12 month return is the purest recency number there is: it is one window, the most recent, presented as if it described the strategy. The checks in the opening all say the same thing in different words. Look at every window, not the last one.
So I ran that check on our own model strategies, because I would rather show the problem on numbers I publish than on someone else's. For each strategy I computed every rolling 12 month return in the back test, month by month, then picked out the best window, the worst window, and what happened in the 12 months right after the best one.
- Smallcap, best 12 months161.35%
- Smallcap, next 12 months4.32%
- Smallcap, worst 12 months-8.71%
- Focused Largecap 20, best119.63%
- Focused Largecap 20, next-8.36%
- Focused Largecap 20, worst-16.84%
Rolling 12 month returns from month end values, from each model's start to Apr 2026. Best windows end Oct 2023 (Smallcap) and Nov 2023 (Focused Largecap 20). Model, back tested, as of 27 Apr 2026. RupeeCase lineup.json.
The Smallcap model's best 12 months ended in Oct 2023 at plus 161.35 percent. Anyone who saw that number and arrived then got plus 4.32 percent over the next 12 months. The Focused Largecap 20 model's best window ended a month later at plus 119.63 percent, and the next 12 months were minus 8.36 percent. Neither strategy broke. The screenshot simply showed the tail of the distribution, and the next year came from the middle of it.
Read the toll, not the prize
Rule two in the opening has a concrete version. Before the best year, ask for the worst rolling window and the maximum drawdown. In the same back test, the Smallcap model had 7 negative rolling 12 month windows out of 51 and a maximum drawdown of 22.34 percent. Focused Largecap 20 had 11 negative windows out of 49 and a maximum drawdown of 23.56 percent. Those are the numbers that decide whether you will still be holding when the next good year arrives.
What would you do?
It is the end of Nov 2023. A strategy shows plus 119.63 percent over the last 12 months on the screen.
- Move the whole SIP into it tonight
The next 12 months in the model were minus 8.36 percent. You would have bought the label at the top of its best window.
- Ask for the worst window and the drawdown first
The same back test shows a worst 12 months of minus 16.84 percent and a 23.56 percent drawdown. You decide on the size you could hold through that, before you look at the best year.
- Wait for another strong year to confirm it
Waiting for a second great year is the same recency bias twice. The next 12 months were minus 8.36 percent, so the confirmation never came.
Focused Largecap 20, rolling 12 month returns and maximum drawdown. Model, back tested, as of 27 Apr 2026. Not a promise of future returns.
Why the crowd always arrives late
The flow asymmetry in the opening is the engine of the crowding problem. Money chases a good trailing number much harder than it leaves a bad one. So the largest amount of money usually sits in a strategy just after its best year, which is exactly when the next year is most likely to be ordinary. The fund's own return, measured from one rupee on day one, can look excellent while the average rupee in it does much worse. The post on herding and social proof works that gap out in rupees.
MythA strategy that did 60 percent last year has proved it works, so now is a safe time to join.
FactLast year is one window. In our own back tests the window after the best year returned plus 4.32 and minus 8.36 percent. The worst window and the drawdown say more about what you will live through.
The three checks, in order
- Name the factorRanked on trailing return means momentum, whatever the label says.
- Read the worst windowWorst rolling 12 months and maximum drawdown, side by side with the best.
- Size for the red stretchPick an amount you would keep investing through months of losses.
The drawdown recovery calculator shows how long a given fall takes to climb back from at a given return. The free Learn module on overconfidence, anchoring and recency bias covers the research behind the checks, with a quiz at the end.
Questions readers ask
What is recency bias in investing?
It is the tendency to expect the most recent result to continue. A trailing 12 month return is one window, so a strategy's best year often looks like its normal year. In our model back tests, the 12 months after the best window returned plus 4.32 percent for Smallcap and minus 8.36 percent for Focused Largecap 20 (Model, back tested, as of 27 Apr 2026).
What is a rolling return and why does it matter?
A rolling 12 month return is the return over every 12 month window in the history, moved forward one month at a time. Looking at all of them, especially the worst one, shows the range you could have lived through instead of the single window on the screen.
What is factor crowding?
When many investors run the same signal, such as ranking stocks by past return, they buy the same stocks at the same time. That narrows the premium and makes reversals sharper when the crowd leaves together.
The cards
3 cards. Swipe, or tap to open.
Explore next
Learn it properly, then see it applied.
- Free module 8.1Why Investors Lose, Introduction to Behavioural Finance11 min read
- StrategyAllcap strategyNifty Total Market, 50 stocks, every 2 weeks
- Free module 8.3Cognitive Biases: Overconfidence, Anchoring and Recency Bias10 min read
- CalculatorDrawdown and recoveryFree, with the formula and a worked example
- Blog topicBehaviour notes27 notes
Related
- Sunk cost: the first loss is the cheapestA 35 percent hole needs 54 percent to climb out, and a Rs 65,000 rump held flat for three years forgoes about Rs 30,000 against cutting and redeploying at the index.Behaviour . . 5 min
- Mental accounting: the bonus that feels differentThaler's mental accounting explains why a Diwali bonus gets spent and a salary SIP never misses, and a Rs 2 lakh splurge carries a thirty year bill of about Rs 60 lakh.Behaviour . . 5 min
- By the time the group agrees, the trade is finishedA momentum strategy's time weighted 16.7 percent CAGR became about minus 4.9 percent money weighted, because the crowd arrived the year after the 72 percent print.Behaviour . . 5 min
Educational content only. Figures are illustrative and computed on historical or representative data for teaching purposes, not investment advice. Past performance does not guarantee future returns. Sourced from NSE, BSE, SEBI, AMFI and RBI public data.