

Company numbers..7 min read
DuPont: same ROE, three different businesses
Three Nifty 200 stocks at 20 percent ROE got there by margin, by turnover and by a 4x equity multiplier, and only one of those levers survives a bad year cleanly.
By Tanmay Kurtkoti, founder of QC Alpha and builder of RupeeCase
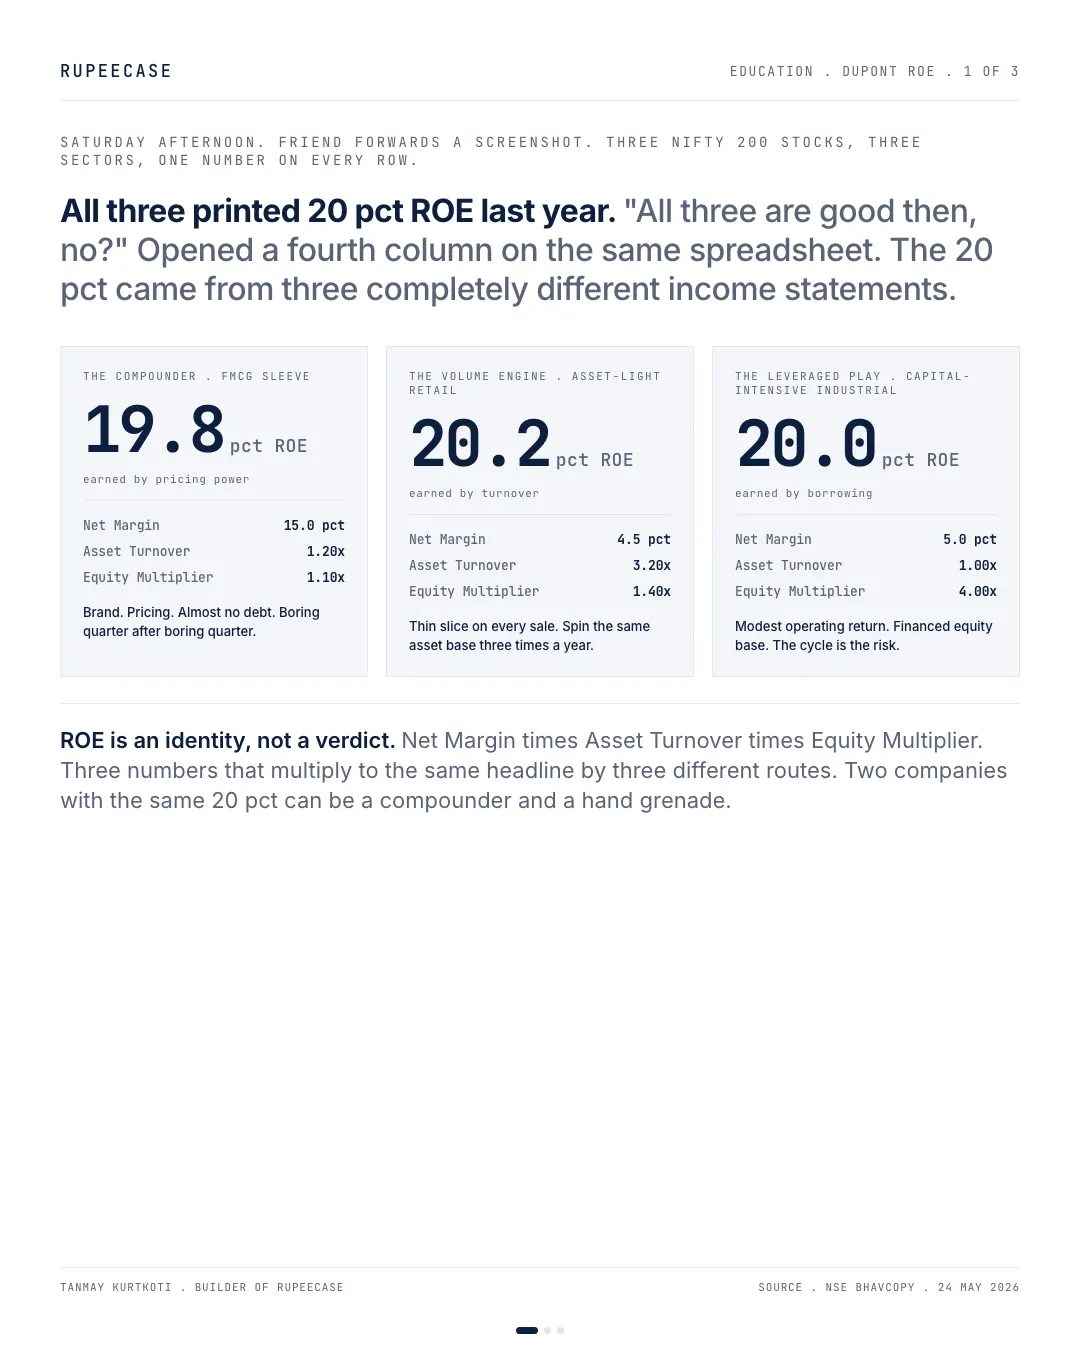
Saturday afternoon. Friend forwards a screenshot of three Nifty 200 stocks. Three different sectors. Three names you would never put in the same group chat. All three printed 20 pct Return on Equity last year. He asks, "all three are good then, no?"
Opened a fourth column on the same spreadsheet. The 20 pct came from three completely different income statements.
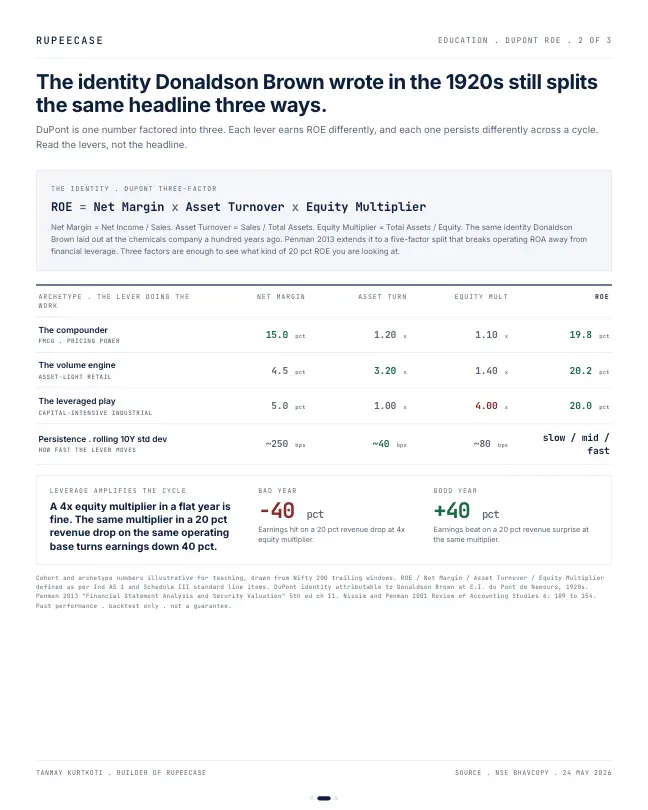
DuPont, the same identity Donaldson Brown wrote at the chemicals company in the 1920s, splits ROE into three honest levers. Net Margin times Asset Turnover times Equity Multiplier. Three numbers that multiply to the same headline by three different routes.
The compounder. FMCG sleeve. 15 pct net margin, 1.20 asset turnover, 1.10 equity multiplier. ROE 19.8 pct. The headline is earned by pricing power and brand loyalty.
The volume engine. Asset-light retailer. 4.5 pct net margin, 3.20 asset turnover, 1.40 equity multiplier. ROE 20.2 pct. The headline is earned by spinning the same store three times a year and clipping a thin slice every spin.
The leveraged play. Capital-intensive industrial. 5 pct net margin, 1.00 asset turnover, 4.00 equity multiplier. ROE 20.0 pct. The headline is earned by financing the equity base with debt.
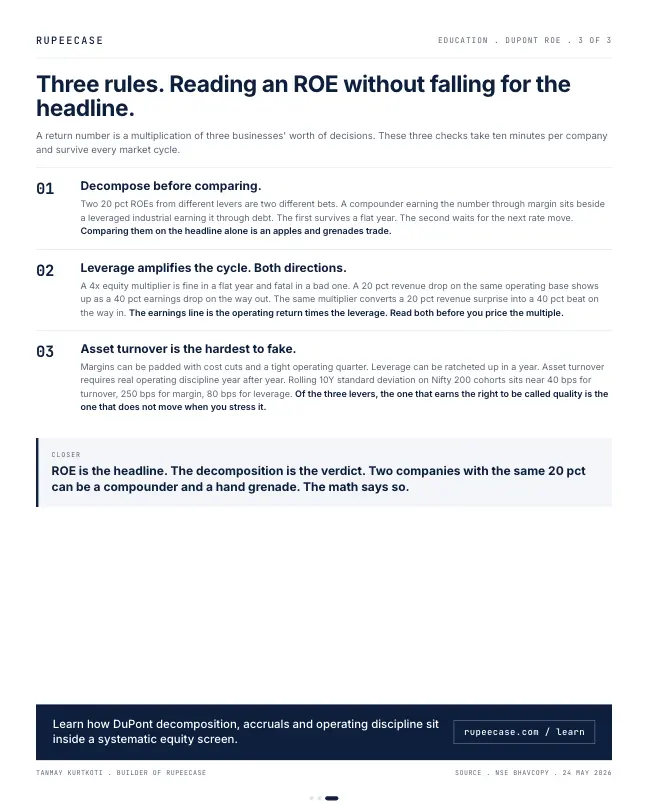
The lever decides what happens to the next year. A 4x equity multiplier in a flat year is fine. In a 20 pct revenue drop on the same operating base, that same multiplier turns earnings down 40 pct. Leverage amplifies the cycle. Both directions.
Asset turnover is the slowest-moving lever. Rolling 10Y standard deviation on the Nifty 200 cohorts sits near 40 bps for turnover, 250 bps for margin, 80 bps for leverage. Margins can be padded with cost cuts. Leverage can be ratcheted up in a year. Turnover requires real operating discipline year after year. It is the lever that earns the right to be called quality.
ROE is the headline. The decomposition is the verdict. Two companies with the same 20 pct can be a compounder and a hand grenade
Three ratios you can pull from one annual report
You do not need a screener to run DuPont. Every number sits in two statements: the profit and loss account and the balance sheet. Each lever is one division, and the three divisions multiply back to ROE because the sales and the assets cancel out.
- Net marginNet profit divided by sales. How much of each rupee of sales the owners keep.
- Asset turnoverSales divided by total assets. How many rupees of sales each rupee of assets produces in a year.
- Equity multiplierTotal assets divided by shareholders' equity. How much of the asset base the owners funded themselves.
- MultiplyMargin times turnover times multiplier equals net profit divided by equity. That is ROE.
Margin times turnover on its own is return on assets. That is the part the business earns. The multiplier is the part the balance sheet adds on top. When I read a high ROE, the first thing I want to know is how much of it came before the multiplier and how much came from it.
Put rupees on the three companies
Give all three Rs 1,000 crore of sales so the comparison is clean. Company A, the compounder, earns Rs 150 crore of net profit on Rs 833 crore of assets, funded by Rs 758 crore of equity. Company B, the volume engine, earns Rs 45 crore on just Rs 313 crore of assets and Rs 223 crore of equity. Company C, the leveraged play, earns Rs 50 crore on Rs 1,000 crore of assets, but its owners put in only Rs 250 crore. The other Rs 750 crore is borrowed.
Divide and you get the opening's numbers. A: Rs 150 crore over Rs 758 crore is 19.8 percent. B: Rs 45 crore over Rs 223 crore is 20.2 percent. C: Rs 50 crore over Rs 250 crore is 20.0 percent. Return on assets tells the real story underneath. A earns 18.0 percent on its assets, B earns 14.4 percent, and C earns 5.0 percent. C reaches the same ROE only because a small slice of equity is carrying a large asset base.
The same bad year, three different results
Now run the opening's 20 percent revenue drop through all three. To keep it fair, assume each company keeps its operating margin, so operating profit also falls 20 percent. Treat every rupee of liabilities as borrowing at 9 percent and tax at 25 percent. Both are simplifications for the example.
Company C's operating profit was Rs 134 crore. Its interest bill on Rs 750 crore at 9 percent is Rs 67.5 crore, and that bill does not shrink with sales. After the fall, operating profit is Rs 107 crore. Take off the same Rs 67.5 crore of interest and profit before tax is Rs 40 crore, down from Rs 67 crore. After tax, net profit goes from Rs 50 crore to about Rs 30 crore. That is the 40 percent fall in the opening, from a 20 percent fall in sales.
Company A pays under Rs 7 crore of interest, so its net profit falls from Rs 150 crore to Rs 119 crore, about 21 percent. Company B falls about 23 percent, to Rs 35 crore. Same shock. A and B move roughly with sales. C moves twice as hard.
- A, the compounder-20.7%
- B, the volume engine-22.7%
- C, the leveraged play-40.2%
Change in net profit after a 20 percent fall in sales, operating margin held, interest at 9 percent, tax at 25 percent. Worked example, not a company.
ROE tells the same story on the next year's equity. A slips from 19.8 to 15.7 percent. B slips from 20.2 to 15.6 percent. C drops from 20.0 to 12.0 percent. Run the shock the other way, a 20 percent rise in sales, and C's profit jumps about 40 percent while the other two rise near 21 to 23 percent. That good year is when a leveraged ROE looks most like quality.
MythA 20 percent ROE is a 20 percent ROE. The higher the number, the better the business.
FactROE says nothing about how it was earned. Company C earns 5 percent on its assets and borrows the rest of the way to 20, so a 20 percent sales drop cuts its profit 40 percent.
Read the levers over five years, not one
One year of DuPont is a snapshot. Five years is the verdict. Put the three ratios side by side for each year and look at which one moved. If ROE rose because margin rose, ask whether it was price, mix or a cost cut that will not repeat. If it rose because turnover rose, the business is getting more out of the same plant, and that is the hardest gain to fake. If it rose because the multiplier rose, the company borrowed more, and the risk rose with it.
This is why the free Learn module on capital allocation treats ROE as the start of the question, not the answer. It walks through what a company does with the profit it keeps, and why the return on the next rupee matters more than the return on the last one. The post on ROCE against the cost of capital takes the same idea one step further, by asking whether the return even beats what the capital costs.
Questions readers ask
What is the DuPont formula for ROE?
ROE equals net margin times asset turnover times the equity multiplier. Net margin is net profit over sales, turnover is sales over total assets, and the multiplier is total assets over shareholders' equity. Multiply the three and sales and assets cancel, leaving net profit over equity.
Is a high equity multiplier always bad?
No. Banks and lenders run high multipliers by design, and a steady business can carry some debt safely. The risk is a high multiplier on a cyclical business with a thin return on assets, because interest is fixed and a fall in sales hits profit far harder, as Company C shows.
Where do I find the numbers for a DuPont analysis of an Indian company?
Net profit and sales are on the statement of profit and loss, and total assets and total equity are on the balance sheet, both in the annual report filed with NSE and BSE. Use the average of opening and closing assets and equity for a cleaner figure, and repeat it for five years.
The cards
3 cards. Swipe, or tap to open.
Related
- ROCE below WACC is capital destroyed politelySales up 9 percent and ROCE up 4 points still destroy value when ROCE sits at 9 and the cost of capital at 12, because EPS rises the day you borrow and EVA does not.Company numbers . . 5 min
- Three ways to make eighteen percentA brand, a retailer and a lender all show 18 percent ROE from 18x1x1, 3x3x2 and 20x0.09x10, and their returns on assets are 18, 9 and 1.8 percent.Company numbers . . 12 min
- Same net profit, two different quartersTwo companies printing Rs 245 crore of net profit collected Rs 220 crore and Rs 38 crore of operating cash, and the accruals gap is the line that does not negotiate.Company numbers . . 5 min
Educational content only. Figures are illustrative and computed on historical or representative data for teaching purposes, not investment advice. Past performance does not guarantee future returns. Sourced from NSE, BSE, SEBI, AMFI and RBI public data.