

Company numbers..6 min read
Brent: absorbers, amplifiers and the OMC counter trade
A crude move hits upstream energy on the revenue line, aviation and paints on the cost line, and oil marketing companies the opposite way to ONGC despite the same sector tag.
By Tanmay Kurtkoti, founder of QC Alpha and builder of RupeeCase
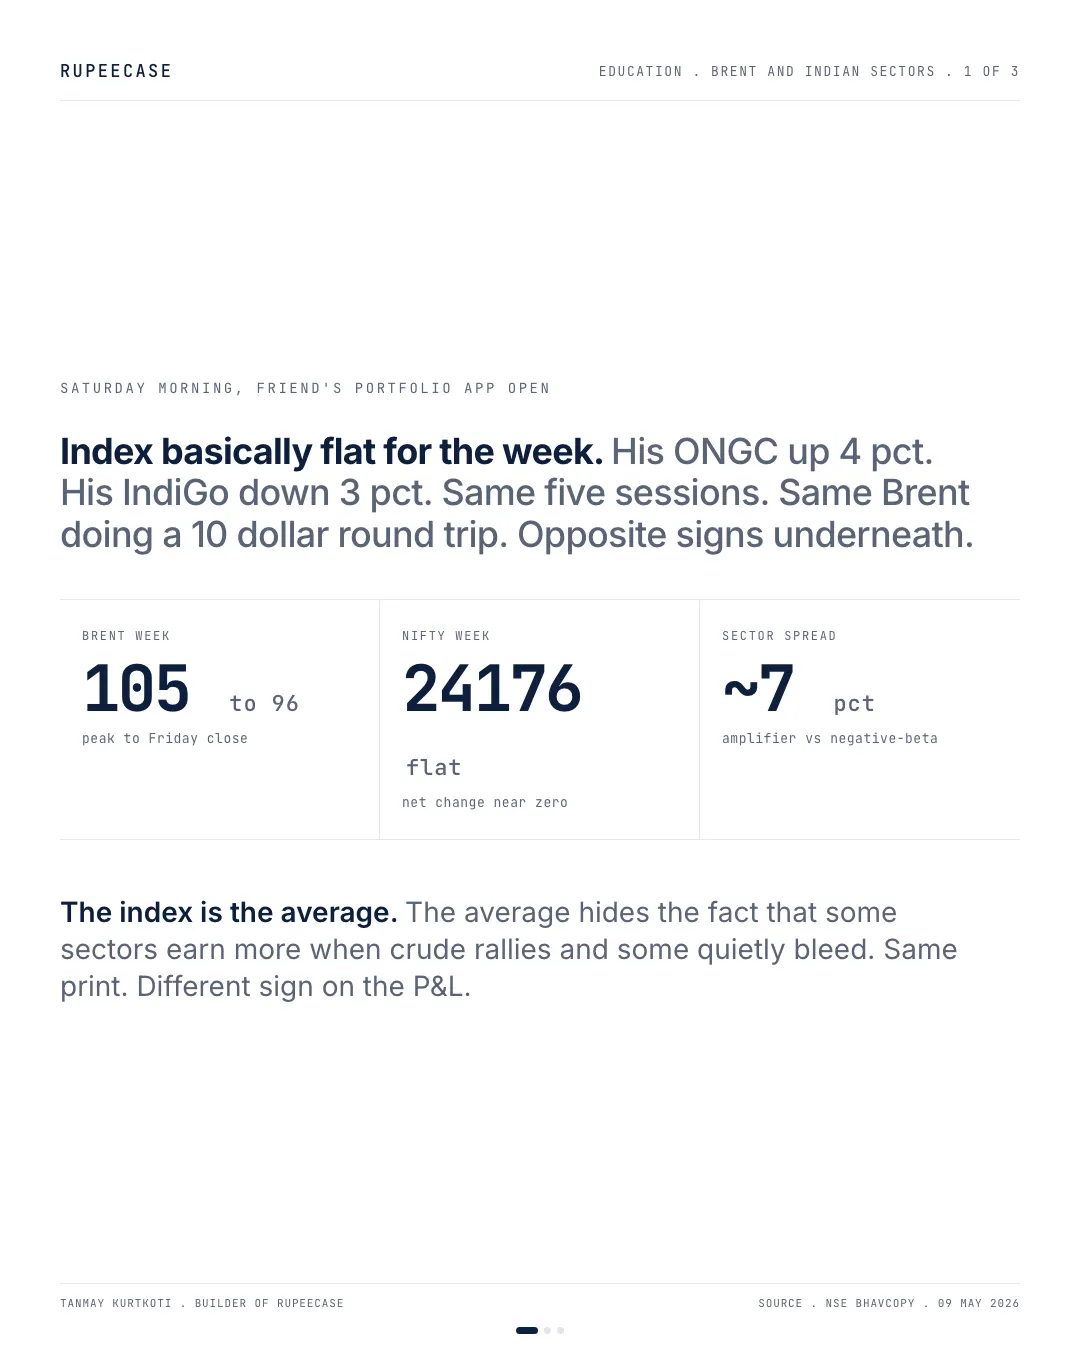
Saturday morning. Friend's brokerage app open on the kitchen counter. Nifty was basically flat for the week. His ONGC was up around 4 percent. His IndiGo was down 3. Same five sessions. Same Brent doing a 10 dollar round trip from a 105 print earlier in the week back to 96 by Friday close. Opposite signs underneath an index that did nothing.
The index is an average. The average is what hides the trade.
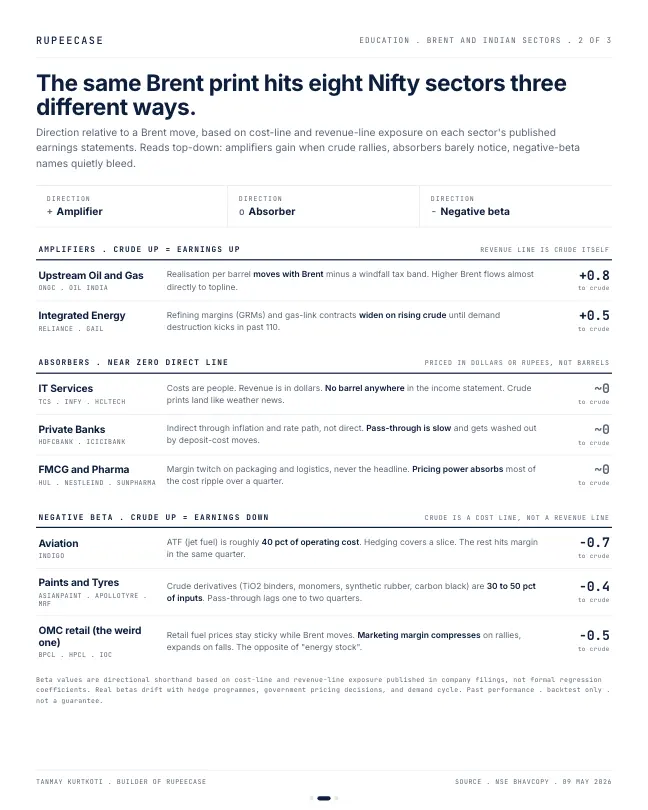
A Brent print does not hit eight Nifty sectors the same way. It hits them three different ways, and the way to see it is to look at which line of the income statement crude actually touches first. Upstream and integrated energy names like ONGC, OIL INDIA, RELIANCE, GAIL are amplifiers. Crude sits on the revenue line minus a windfall tax band. An up-Brent week flows almost directly to topline. IT services, private banks, and most of FMCG and Pharma are absorbers. There is no barrel anywhere on the income statement. Costs are people, deposits, or branded goods. Brent prints land like weather news.
The third bucket is the negative-beta one and the one most retail investors get wrong. Aviation puts ATF on the cost line at roughly 40 percent of operating cost. Paints and tyres run on crude derivatives. The same Brent rally that lifted ONGC compressed those margins. And then there is the counterintuitive block. BPCL, HPCL, IOC are retail margin businesses sitting inside an energy ticker. India's pump prices are administered and sticky. When Brent rallies their marketing margin compresses, when Brent falls it expands. They are the opposite trade to ONGC even though every screener parks them in the same sector.
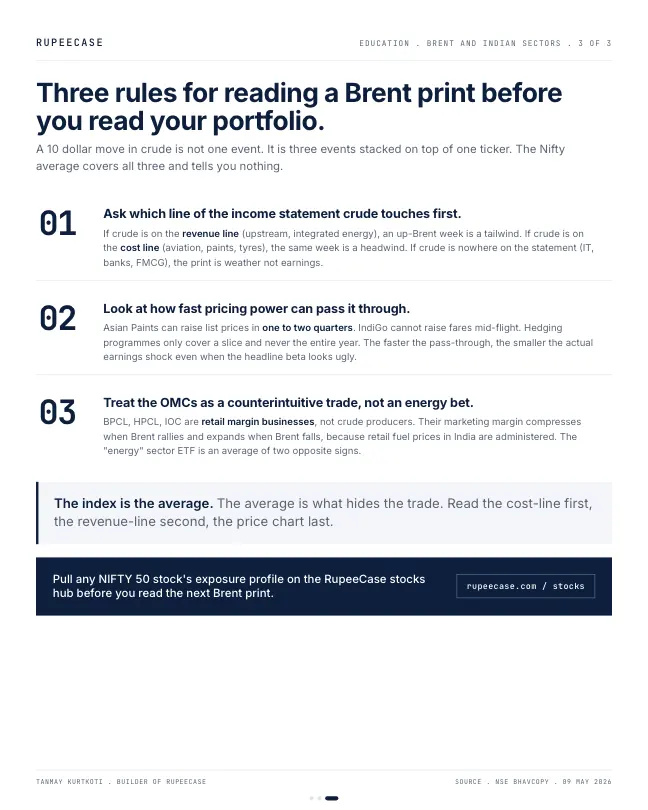
So three rules I run before I read the next Brent print. Which income-statement line does crude touch first. How fast can pricing power pass it through. And remember the OMCs are a counter trade, not an energy bet. Read the cost line first. Read the revenue line second. Read the price chart last
One formula for all four buckets
Every company in the opening can be described with two numbers: how much of its revenue moves with crude, and how much of its costs do. The effect of a crude move on profit is the gap between the two, times the move, divided by the margin.
Change in operating profit = (crude linked revenue share minus crude linked cost share) x crude move / operating margin.
The margin is in the denominator for a reason. A thin margin business has little room, so the same cost shock eats a larger share of its profit. That is why an airline and an oil marketer react so violently to moves that barely register for a software exporter.
Four hypothetical companies, one 10 percent rise in crude
Give each one Rs 10,000 crore of revenue so the numbers line up.
Company A produces crude. All its revenue moves with the crude price, and its Rs 6,000 crore of costs do not. Operating profit is Rs 4,000 crore, a 40 percent margin. Crude rises 10 percent, revenue rises Rs 1,000 crore, profit rises to Rs 5,000 crore. Plus 25 percent. That is an amplifier.
Company B is an airline. Fuel is Rs 3,600 crore, 40 percent of its Rs 9,000 crore of operating cost, as in the opening. Operating profit is Rs 1,000 crore. Crude up 10 percent adds Rs 360 crore to the fuel bill. Profit falls to Rs 640 crore, minus 36 percent, until fares catch up.
Company C writes software. No barrel anywhere in its accounts. Profit does not move. That is an absorber.
Company D refines and sells fuel at pump prices that do not change quickly. Its crude bill is Rs 8,000 crore, other costs Rs 1,200 crore, profit Rs 800 crore. Crude up 10 percent adds Rs 800 crore of cost against the same revenue. Profit goes to zero. Minus 100 percent, from a 10 percent move, in a company the screener files under energy next to Company A.
- A, producer+25%
- C, software0%
- B, airline-36%
- D, fuel retailer-100%
Change in operating profit for a 10 percent rise in crude, before any price change. Worked example in Rs crore, not a company.
Pass through decides how long it hurts
The numbers above are the first quarter after a move, before anyone changes a price. What happens next depends on pricing power. An airline can raise fares within weeks if demand holds. A paint or tyre maker raises list prices, but with a lag of a quarter or two, so the cost shows up first and the price rise later. A fuel retailer whose pump price is sticky may wait much longer. Run the same 10 percent fall in crude and every sign flips: Company D's profit doubles, and Company A gives back a quarter.
Crude on the revenue line
- Crude up: revenue up, costs flat
- Profit up 25 percent on a 10 percent move
- Crude down hurts
Crude on the cost line
- Crude up: costs up, pump price sticky
- Profit gone on a 10 percent move
- Crude down helps
Reading the line before the price
- Which line does crude touch?Revenue for producers, cost of materials or fuel for users, nowhere for most services.
- How big is the share?Fuel or crude as a percentage of revenue, from the expense note in the annual report.
- How thin is the margin?The thinner it is, the larger the profit swing for the same share.
- How fast can prices follow?Weeks for some, quarters for others, longer where prices are administered.
This is the same reading that drives the corporate earnings cycle in India: a commodity move shows up first in input costs and margins, then in prices, then in earnings estimates. The free Learn module on the corporate earnings cycle in India walks through that sequence step by step. The post on the rupee at a record low uses the same revenue line against cost line split for currency, and crude and the rupee often move together.
MythEvery energy stock rises when crude rises.
FactProducers carry crude on the revenue line and gain. Fuel retailers with sticky pump prices carry it on the cost line and lose. The sector label hides opposite trades.
Questions readers ask
Which Indian sectors benefit when crude oil prices rise?
Businesses with crude on the revenue line, such as upstream oil and gas producers, gain when crude rises because revenue goes up while most of their costs do not. Sectors with crude on the cost line, such as aviation, paints and tyres, lose margin until they can raise prices.
Why do oil marketing companies fall when crude rises?
They buy crude at market prices but sell fuel at pump prices that change slowly. When crude rises, their costs rise first and their marketing margin shrinks. In the worked example, a 10 percent rise in crude wipes out a fuel retailer's operating profit before any price change.
How do I measure a company's sensitivity to crude oil?
Estimate the share of revenue and the share of costs linked to crude, then divide the gap by the operating margin. A company with no crude linked revenue, crude costs of 36 percent of revenue and a 10 percent margin loses about 36 percent of operating profit for every 10 percent rise in crude.
The cards
3 cards. Swipe, or tap to open.
Related
- A record low rupee redistributes, it does not subtractWith USD INR at 95.85, exporters earning in dollars gained on the revenue line while importers lost on the cost line and the neutral core did not move.Company numbers . . 6 min
- Same net profit, two different quartersTwo companies printing Rs 245 crore of net profit collected Rs 220 crore and Rs 38 crore of operating cash, and the accruals gap is the line that does not negotiate.Company numbers . . 5 min
- DuPont: same ROE, three different businessesThree Nifty 200 stocks at 20 percent ROE got there by margin, by turnover and by a 4x equity multiplier, and only one of those levers survives a bad year cleanly.Company numbers . . 7 min
Educational content only. Figures are illustrative and computed on historical or representative data for teaching purposes, not investment advice. Past performance does not guarantee future returns. Sourced from NSE, BSE, SEBI, AMFI and RBI public data.