


Behaviour..9 min read
Confirmation bias: research or hope
Lord, Ross and Lepper's 1979 study showed mixed evidence hardens both sides, and cutting at minus 15 instead of holding through minus 40 ends Rs 3.51 lakh ahead on Rs 10 lakh.
By Tanmay Kurtkoti, founder of QC Alpha and builder of RupeeCase
Last Thursday a friend sent me his watchlist notes on a stock he has held for fourteen months. Four bullet points. Every one of them was a reason to stay in. He had underlined "strong promoter" twice.
I asked him what he had written before he bought. He scrolled back. Five bullet points. Three of them were about the balance sheet. One was a valuation concern. One was about the sector cycle.
The pre-buy note and the post-buy note were about two different companies. Same ticker. Same person writing. But somewhere between the order confirmation and the next earnings call, the research shifted from deciding to defending.
That shift has a name. Psychologists call it confirmation bias. And in 1998, Raymond Nickerson published a 46-page review in the Review of General Psychology arguing that if one problematic aspect of human reasoning deserves attention above all others, confirmation bias has to be among the candidates. Not the rarest. Not the most exotic. Among the most problematic. It shows up in medicine, in law, in engineering, and it shows up in your portfolio the day after you buy.
The study that made it visible
In 1979, Charles Lord, Lee Ross, and Mark Lepper ran a now-classic experiment at Stanford. They recruited two groups: people who supported the death penalty and people who opposed it. Both groups read the same two fictional studies on whether capital punishment deters crime. One study said yes. The other said no. Same evidence packet. Same reading time.
The rational prediction is that mixed evidence should moderate both groups. Move everyone a little toward the middle.
The opposite happened. Supporters rated the pro-deterrence study as more convincing and the anti-deterrence study as flawed. Opponents did the mirror image. After reading identical mixed evidence, both groups reported that their original position had grown stronger.
That result was published in the Journal of Personality and Social Psychology (volume 37, pages 2098 to 2109). It has been replicated dozens of times since, across domains that have nothing to do with criminal justice. Including finance.
What this looks like in a portfolio
You buy a stock at Rs 420. It drops to Rs 370. You open the annual report. But you are not reading the annual report the way you read it before the buy. Before the buy, you were weighing evidence. After the buy, you are filtering it.
Good quarter? Confirms the thesis. Bad quarter? One-off, macro headwinds, sector rotation, management said next quarter will be better. Analyst downgrade? They do not understand the business. Peer outperforming? Different market segment, not comparable.
None of these responses are stupid. Individually, each one might even be correct. The problem is the pattern. Every piece of incoming evidence gets routed through a filter that was not there before you owned the position. And the filter has one job: keep the thesis alive.
Put the two notes side by side and the change is easy to see. Same reader, same company, different job.
Weighing evidence
- Balance sheet, valuation, sector cycle
- Bad news counts as much as good news
- The question: should I own this?
Filtering evidence
- Promoter quality, underlined twice
- Bad news becomes a one-off
- The question: how do I keep this?
The math hiding behind the bias
The real cost is not the bad quarter. It is the quarters you spend defending a position that a rule would have cut.
Here is the recovery asymmetry table. Once a position drops, the return needed to get back to zero is not the same number with a plus sign. It is worse. And it gets worse fast.
At minus 10, the gap is small. You barely notice. At minus 40, you need plus 66.7 just to get back to where you started. Not to make money. Just to break even. And the longer you spend defending the thesis instead of acting on the math, the deeper you slide down this curve.
Two paths from the same starting point
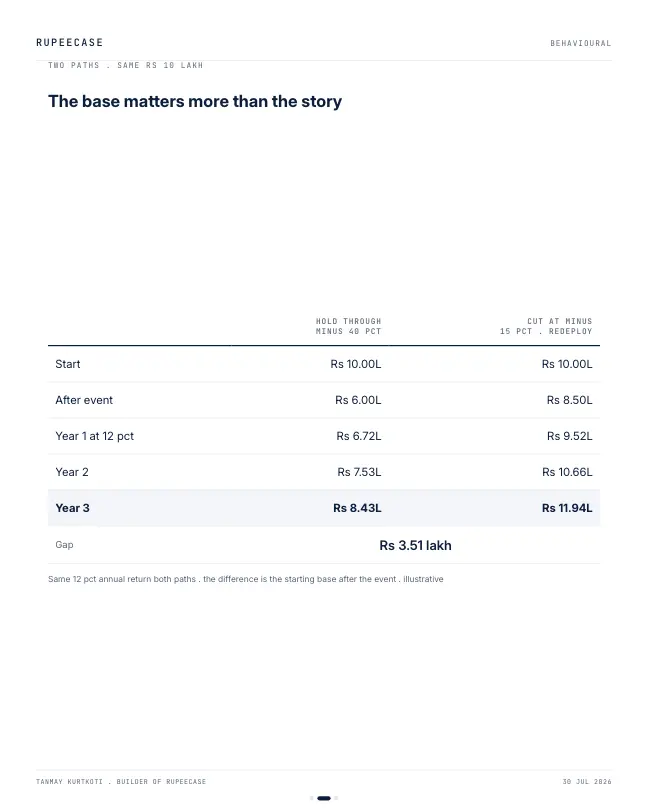
I ran two paths on a Rs 10 lakh position. Same stock. Same starting day. Different rules.
Path A holds through a 40 percent drawdown. The position drops to Rs 6 lakh. Then the market recovers at 12 percent a year for three years. After three years, the position is worth Rs 8.43 lakh. Still underwater. Still 1.57 lakh short of the original 10.
Path B cuts at minus 15 percent. The position exits at Rs 8.5 lakh. The proceeds redeploy into the broader portfolio at 12 percent a year. After three years, the redeployed capital is worth Rs 11.94 lakh. Above water. Growing.
| Start | After event | Year 1 | Year 2 | Year 3 | |
|---|---|---|---|---|---|
| Path A . hold through minus 40 pct | Rs 10.00L | Rs 6.00L | Rs 6.72L | Rs 7.53L | Rs 8.43L |
| Path B . cut at minus 15 pct, redeploy | Rs 10.00L | Rs 8.50L | Rs 9.52L | Rs 10.66L | Rs 11.94L |
| Gap | 0 | Rs 2.50L | Rs 2.80L | Rs 3.13L | Rs 3.51L |
The gap at year three is Rs 3.51 lakh. Not because Path B found a miracle. The return assumption is the same 12 percent. The difference is that Path B started the recovery from a higher base. Compounding cares about the base. That is the entire lesson.
Change the inputs and the lesson holds. The drawdown you sat through sets the base, and the base decides everything after it. The last line answers the question the table leaves open: how long Path A needs just to get back to Rs 10 lakh.
On the default inputs the break even comes out at 4.5 years, which the post rounds to five. Either way it is half a decade of standing still.
And a 40 percent drawdown, even at 12 percent annual returns, takes about five years just to get back to breakeven. Five years of zero net gain. That is the cost of defending the thesis.
The loop you cannot see from inside
Here is what happens when confirmation bias runs a portfolio instead of a rule.
The discretionary path loops. Buy, seek confirming evidence, dismiss contrary data, hold, loop back. The deeper the loss, the stronger the confirmation bias, the tighter the loop. It is self-reinforcing.
The rule-based path does not loop. Entry rule met. Periodic check. Rule decides. If the exit condition fires, the position closes. No thesis to defend. No identity tied to the outcome. The rule does not care that you liked the management.
The fix is not more research
The fix is deciding what counts as evidence before you own the position.
MythWhen a stock falls, more research is the responsible next step.
FactResearch done after the fall is read through the position you already hold. Lord, Ross and Lepper showed in 1979 that mixed evidence makes people more sure of what they already believed.
Write the exit condition on the day you buy. (If you have not done the risk profile yet, start there.) Not "I'll reassess if things change." Something specific. A trailing stop. A rebalance cycle. A minimum score on whatever framework you use. If the condition fires, you act. You do not reopen the thesis for one more quarter.
The hardest part is not the math. The math is arithmetic. The hardest part is admitting that the research you do after buying might not be research at all. It might just be a very well-read version of hope.
I keep three rules on the checklist for this:
- Write the thesisThree reasons to own it, in plain words, before the order.
- Write the exitOne condition that proves the thesis wrong: a level, a score, a date.
- Fix the checkA calendar date when the rule runs, not a mood.
- Let the rule actIf the condition fires, the position closes. No extra quarter.
Write the exit before you write the buy. If you cannot articulate what would make you sell, you do not have a thesis. You have an attachment.
Separate the check from the conviction. The rule checks the position. You do not get a vote on the day the rule runs. Your job is to set the rule. The rule's job is to enforce it.
Trust the base, not the story. A position that starts its recovery from Rs 8.50 lakh will outperform a position that starts from Rs 6 lakh at the same return rate. Every single time. The math does not negotiate.
Confirmation bias is invisible from the inside. That is the whole point. You think you are being thorough. You think you are doing due diligence. You are. Just for the wrong side.
The rule does not make you smarter. It makes you honest.
Why a rule does not suffer from this
A rule has no memory of why it bought. On each rebalance it scores every candidate on the same inputs, the position you hold and the one you never owned. That is the part a human cannot copy, because a human cannot forget the purchase. The free Learn module on cognitive biases covers overconfidence, anchoring and recency, the biases that travel with this one, with a quiz at the end. Its twin on the sell side is the disposition effect.
Questions readers ask
What is confirmation bias in stock investing?
It is the habit of seeking and trusting information that supports a position you already hold, and discounting information against it. It usually starts the day after the buy, when research quietly turns from deciding into defending.
How long does a 40 percent loss take to recover at 12 percent a year?
About 4.5 years. A 40 percent fall needs a 66.7 percent gain to break even, and 12 percent a year compounds to that in a little over four and a half years, with no net gain in between.
How can an investor reduce confirmation bias?
Decide before the buy what evidence would prove the idea wrong, and write the exit condition down with a fixed review date. Then let the condition act rather than reopening the thesis each time it fires.
The cards
3 cards. Swipe, or tap to open.

Explore next
Learn it properly, then see it applied.
- Free module 8.1Why Investors Lose, Introduction to Behavioural Finance11 min read
- StrategyAllcap strategyNifty Total Market, 50 stocks, every 2 weeks
- Free module 8.3Cognitive Biases: Overconfidence, Anchoring and Recency Bias10 min read
- CalculatorDrawdown and recoveryFree, with the formula and a worked example
- Blog topicBehaviour notes27 notes
Related
- The disposition effectOdean found investors 1.5 times more likely to sell a winner than a loser, and the winners they sold beat the losers they kept by 3.4 points over the next year.Behaviour . . 10 min
- Risk tolerance is a moodGuiso, Sapienza and Zingales found risk aversion rose sharply after 2008 on fear rather than wealth, so ask the drawdown question in rupees, not percentages.Behaviour . . 5 min
- Doing nothing is the skillKeepers who stay in the centre save about a third of penalties and dive anyway; the investor who sold a 30 percent fall and bought back higher ended with 3,000 fewer units.Behaviour . . 5 min
Educational content only. Figures are illustrative and computed on historical or representative data for teaching purposes, not investment advice. Past performance does not guarantee future returns. Sourced from NSE, BSE, SEBI, AMFI and RBI public data.