


Behaviour..10 min read
The disposition effect
Odean found investors 1.5 times more likely to sell a winner than a loser, and the winners they sold beat the losers they kept by 3.4 points over the next year.
By Tanmay Kurtkoti, founder of QC Alpha and builder of RupeeCase
Saturday afternoon. Cousin sends a screenshot of his portfolio app. Two positions side by side. One is green, up twenty-odd percent. The other is red, down about fifteen. He has already sold the green one. His caption: "locked in the profit."
I ask about the red one.
"Still holding. It'll come back."
I have heard this exact conversation at least twenty times. Different cousins, different friends, different stocks. The script never changes. Sell the winner because it feels good. Hold the loser because selling it would mean admitting you were wrong.
The stock you feel best about selling is almost certainly the one you should have kept. And the one you refuse to sell is the one quietly bleeding your portfolio dry.
Terrance Odean opened ten thousand brokerage accounts and found the same pattern
In 1998, a finance professor named Terrance Odean got access to the trading records of ten thousand individual accounts at one of America's largest discount brokerages. Seven years of data. Close to a hundred thousand trades. He was looking for one thing: do people sell winners and hold losers?
They do. Systematically.
Sixty percent of every sale in the dataset was a winning position. Forty percent was a losing one. Investors were 1.5 times more likely to sell a stock sitting in the green than one sitting in the red.
Shefrin and Statman had named this pattern thirteen years earlier. They called it the disposition effect: the disposition to sell winners too early and ride losers too long. The name stuck because the behaviour stuck.
The reason is not complicated. Selling a winner gives you a small hit of pleasure. You were right. You timed it. You locked in the gain. Holding a loser avoids the pain of admitting you were wrong. As long as you do not sell, the loss is not real. It is a paper number. It might come back.
The portfolio does not care about your feelings. It keeps score either way.
What happened next to the stocks they sold
This is where Odean's study turns from interesting to expensive. He tracked what happened to the winners people sold and the losers people kept over the following twelve months.
The winners they sold went on to outperform the losers they held by 3.4 percentage points.
Two numbers from the same study carry the whole effect. One is about what people sell. The other is about what that choice cost them over the next year.
more likely to sell a stock in the green than one in the red
Odean, Journal of Finance, 1998
points: how far the winners sold beat the losers kept, next 12 months
Odean, Journal of Finance, 1998
Read that again. The stocks investors chose to keep did measurably worse than the stocks they chose to dump. Not because the market punished them, but because momentum is real. Stocks that have been rising tend to keep rising for a while. Stocks that have been falling tend to keep falling. The disposition effect puts you on the wrong side of both.
Two stocks, two years, one lesson
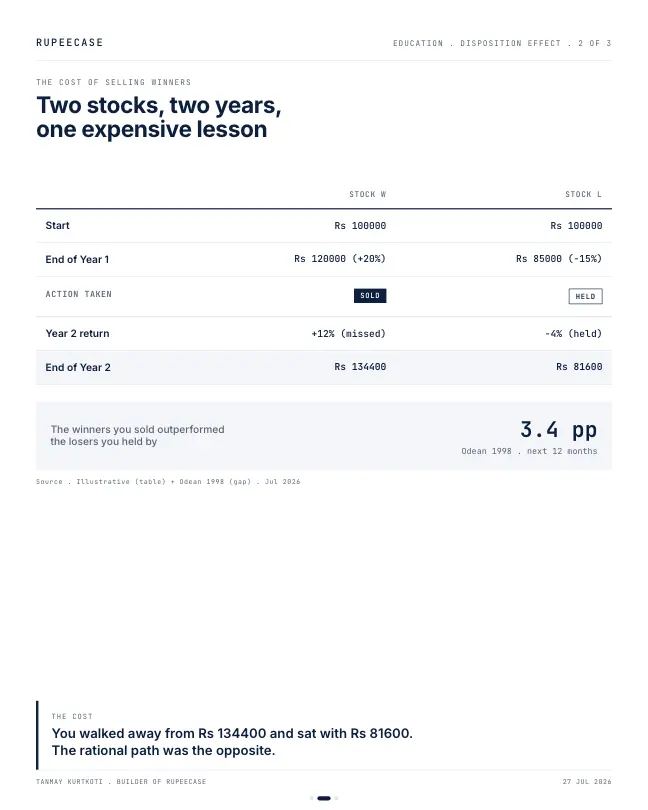
Here is an illustrative version of what this looks like in rupees.
You put Rs 1,00,000 into Stock W and Rs 1,00,000 into Stock L. After one year, W is up 20 percent. L is down 15 percent.
You sell W. Lock in the profit. Hold L because it will come back.
| Stock W | Stock L | Portfolio | |
|---|---|---|---|
| Start | Rs 1,00,000 | Rs 1,00,000 | Rs 2,00,000 |
| End of Year 1 | Rs 1,20,000 (+20%) | Rs 85,000 (-15%) | Rs 2,05,000 |
| Action | Sold | Held | |
| Year 2 (what followed) | Would have returned +12% | Returned -4% | |
| End of Year 2 | Rs 1,34,400 (missed) | Rs 81,600 (held) |
You walked away from Rs 1,34,400 and sat with Rs 81,600. The cash from the winner (Rs 1,20,000) went into something average. The loser kept falling.
Run the same two stocks yourself. The calculator keeps the winner's sale proceeds in cash, earning nothing, which is generous to the reflex. Change the second year and watch how rarely the reflex comes out ahead.
The rational path was the opposite. Hold W. Sell L. Take the loss. Redeploy. But the rational path feels terrible. It means selling the position you are most emotionally attached to (the one that proved you wrong) and keeping the one that gives you no satisfaction (because it has not finished running yet).
Nobody said rational would feel pleasant.
MythBooking a profit is always the safe choice.
FactIt is safe for your feelings. For the portfolio it often removes the position with the stronger trend and keeps the weaker one, and in a short holding period it brings the tax bill forward too.
The tax bill makes it worse
In India, short term capital gains on equity are taxed at 20 percent. Suppose the W sale from the example above sits inside a twelve month window. The Rs 20,000 gain attracts Rs 4,000 in tax.
Had you sold the loser instead, you would have booked a Rs 15,000 loss. That loss offsets the gain. Net taxable gain falls to Rs 5,000. Tax falls to Rs 1,000. You save Rs 3,000 just by selling the position that hurts to sell.
The disposition effect does not only leave money on the table in returns. It hands the tax office a bigger cheque than necessary. Every time you sell a winner and hold a loser in the same financial year, you are volunteering for a higher tax bill. We covered this mechanism in detail in a recent piece on tax loss harvesting.
Here is the same tax arithmetic as a calculator. The rate is the 20 percent that has applied to short term gains on listed equity sold on or after 23 July 2024.
Why a rule does what you will not
A systematic strategy does not know which positions are green and which are red. It does not have a portfolio app with colour coded P&L. It runs a set of rules on a schedule: score the universe, rank, rebalance, repeat.
If the rule says sell Stock L because its momentum score dropped, it sells Stock L. If the rule says hold Stock W because its rank is still high, it holds Stock W. The decision has nothing to do with your purchase price, your gain, your loss, or your feelings about either.
This is the behavioural case for systematic investing, and it has nothing to do with alpha or Sharpe ratios or backtests. It is simpler than that. A rule will make the trade you cannot bring yourself to make. It will sell the loser you are emotionally attached to. It will hold the winner you want to cash in.
The diagram is the whole argument. The emotional path and the systematic path look at the same two positions and reach opposite conclusions. The emotional path asks how you feel about the position. The systematic path asks what the data says about the stock. One optimises for comfort. The other optimises for the portfolio.
Every RupeeCase strategy rebalances on a fixed schedule. Some every week, some every two, three or four weeks. The rebalance does not check your purchase price. It does not know whether you are sitting on a gain or a loss. It scores, ranks, and acts. That indifference is not a bug. It is the product.
The part where this argument breaks
I should be honest about the limits.
First, momentum is not guaranteed. Odean's 3.4 percentage point gap was measured across thousands of accounts over seven years. In any single stock, any single year, the loser might recover and the winner might stall. The edge is statistical, not deterministic. Holding a loss is not always wrong. Holding a loss because you cannot bear to book it always is.
Second, there are legitimate reasons to sell a winner. You might need the cash. The position might have grown too large relative to the book and you are rebalancing for concentration risk, not feelings. A gain on a stock that has changed its fundamentals is a different decision from a gain on a stock you are selling because it feels good.
Third, the disposition effect is measured most clearly in individual stock picking. If you are already in a diversified index fund or a systematic strategy, the manager or the rule is making these calls for you. The bias bites hardest when you are the one clicking sell.
Three things to carry
The sell that feels good is probably the one costing you the most. Ask why you are selling before you click.
A booked loss is not a failure. It is a tool. It offsets a gain, it reduces your tax, it frees capital. The only loss that truly costs is the one you sit in because you cannot face it.
A rebalancing rule does not cure the disposition effect. It sidesteps it entirely. The rule never asks how you feel about the position. That is why it works.
Your portfolio is shaped by the sells you are willing to make. If you can only bring yourself to sell what is green, you are building a collection of red. Eventually the whole book is just the positions you could not bear to close. That is not a portfolio. That is a museum of mistakes you refused to name.
Take the risk profile quiz. It does not ask which stocks you want to sell. It asks how much of a fall you can sit through without acting. The answer to that question decides which systematic strategy fits, and whether you need the kind of strategy that takes these decisions out of your hands altogether.
Check your own last ten sells
The test takes ten minutes with a contract note history. List your last ten sells. Mark each one green or red at the moment you sold. Then list the five positions you have held the longest and mark those too. If the sells are mostly green and the long holds are mostly red, the pattern Odean found in American accounts in the 1990s is running in your own book in 2026.
The free Learn module on the disposition effect walks through the research and the fixes that hold up, with a quiz at the end. The same bias has a cousin that works on the research instead of the sell button, covered in confirmation bias.
Questions readers ask
What is the disposition effect in investing?
It is the habit of selling winning positions too early and holding losing positions too long. Shefrin and Statman named it in 1985, and Odean's 1998 study of 10,000 accounts found investors were about 1.5 times more likely to sell a winner than a loser.
Can I set a short term capital loss against a short term gain in India?
Yes. A short term capital loss on listed equity can be set off against short term or long term capital gains in the same year. In the worked example, booking a Rs 15,000 loss against a Rs 20,000 gain cuts the tax at 20 percent from Rs 4,000 to Rs 1,000.
Does a systematic strategy avoid the disposition effect?
It sidesteps it, because the rule ranks stocks on data and never looks at your purchase price or your gain. The bias can still return if you override the rule, which is why the rebalance only works when it is followed every time.
The cards
3 cards. Swipe, or tap to open.

Explore next
Learn it properly, then see it applied.
- Free module 8.1Why Investors Lose, Introduction to Behavioural Finance11 min read
- StrategyAllcap strategyNifty Total Market, 50 stocks, every 2 weeks
- Free module 8.5The Disposition Effect and How to Beat It9 min read
- CalculatorTax loss harvestingFree, with the formula and a worked example
- Blog topicBehaviour notes27 notes
Related
- Confirmation bias: research or hopeLord, Ross and Lepper's 1979 study showed mixed evidence hardens both sides, and cutting at minus 15 instead of holding through minus 40 ends Rs 3.51 lakh ahead on Rs 10 lakh.Behaviour . . 9 min
- Risk tolerance is a moodGuiso, Sapienza and Zingales found risk aversion rose sharply after 2008 on fear rather than wealth, so ask the drawdown question in rupees, not percentages.Behaviour . . 5 min
- Doing nothing is the skillKeepers who stay in the centre save about a third of penalties and dive anyway; the investor who sold a 30 percent fall and bought back higher ended with 3,000 fewer units.Behaviour . . 5 min
Educational content only. Figures are illustrative and computed on historical or representative data for teaching purposes, not investment advice. Past performance does not guarantee future returns. Sourced from NSE, BSE, SEBI, AMFI and RBI public data.