

Portfolio construction..4 min read
The one country bet
Japan was 45 percent of world equity in 1989 and took 34 years to regain its high; India is about 2.9 percent and most Indian portfolios sit near 100 percent India.
By Tanmay Kurtkoti, founder of QC Alpha and builder of RupeeCase
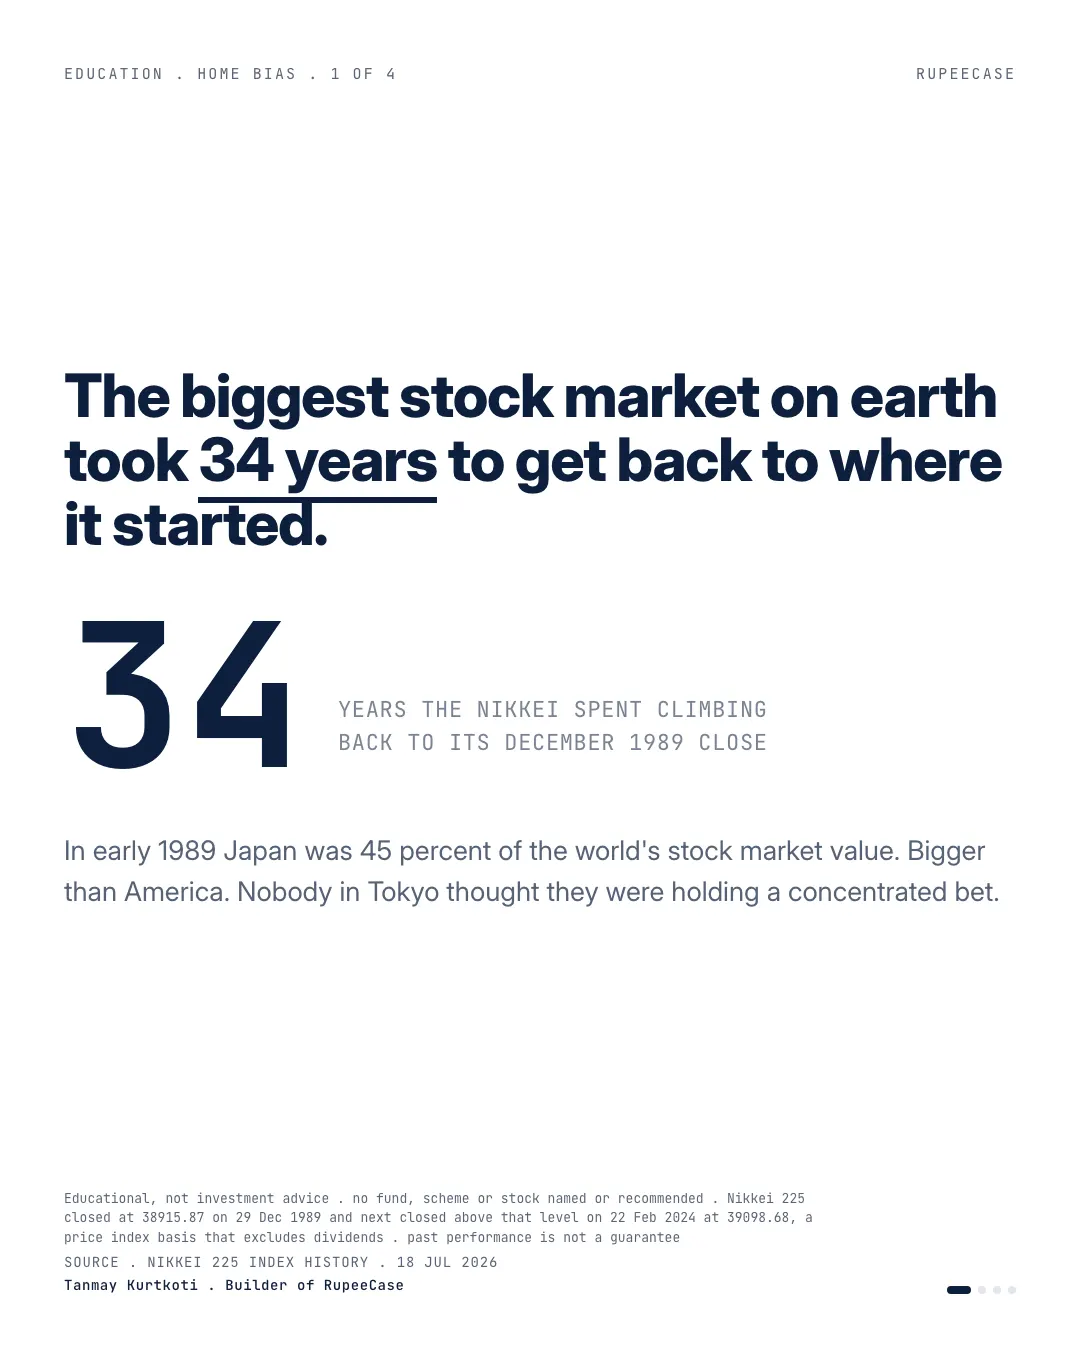
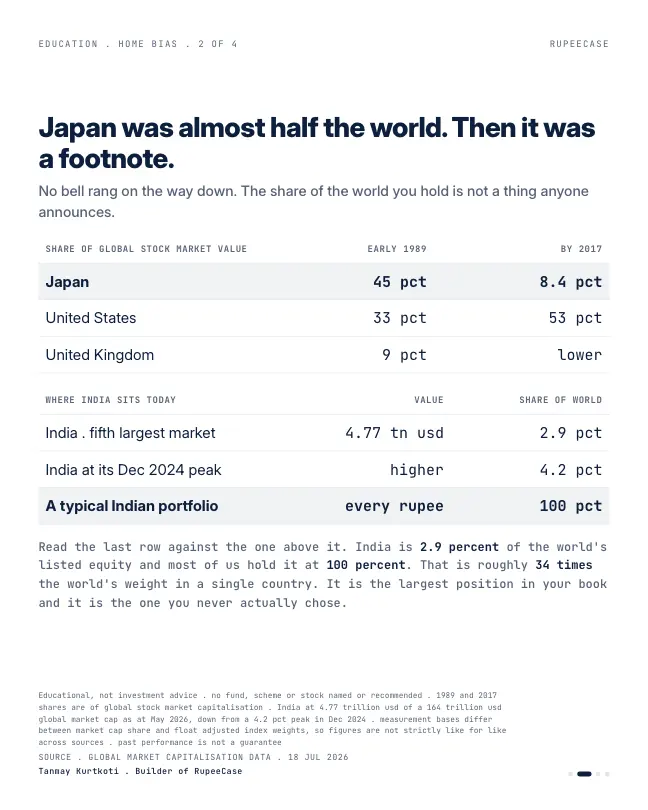
In early 1989, Japan was 45 percent of the world's stock market. Bigger than America, which sat at 33. If you were an investor in Tokyo that year, you owned the biggest, deepest, most obviously permanent market on the planet, and not one person would have described your portfolio as a concentrated bet.
The Nikkei closed at 38,915.87 on the last trading day of 1989. It did not close above that level again until February 2024.
Thirty four years to get back to where you started. By 2017, Japan's share of global market value was 8.4 percent. Nobody rang a bell on the way down.
Now the uncomfortable turn.
India is 2.9 percent of the world's listed equity right now. Roughly 4.77 trillion dollars out of 164 trillion. Fifth largest market on earth, and it was 4.2 percent as recently as December 2024. Meanwhile most Indian portfolios, including plenty of very carefully constructed ones, are close to 100 percent India.
That is about 34 times the world's weight, in one country.
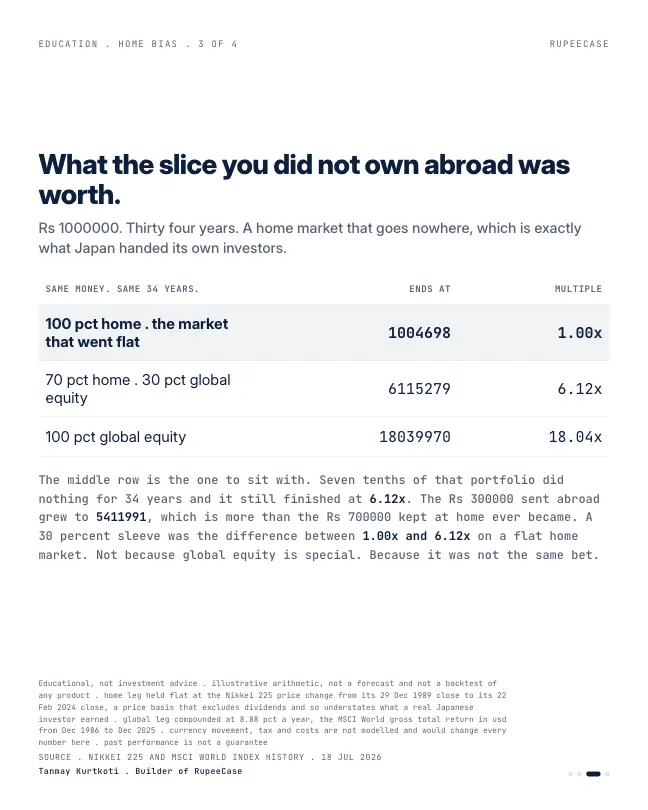
Here's the part nobody tells you. Run Rs 10,00,000 for 34 years against a home market that goes nowhere and you end with 10,04,698. Move just 30 percent of it into global equity at its long run rate and the same pot ends at 61,15,279. The 3 lakh you sent abroad ends up worth more than the 7 lakh you kept. Illustrative arithmetic, not a forecast, but that is the shape of the thing.
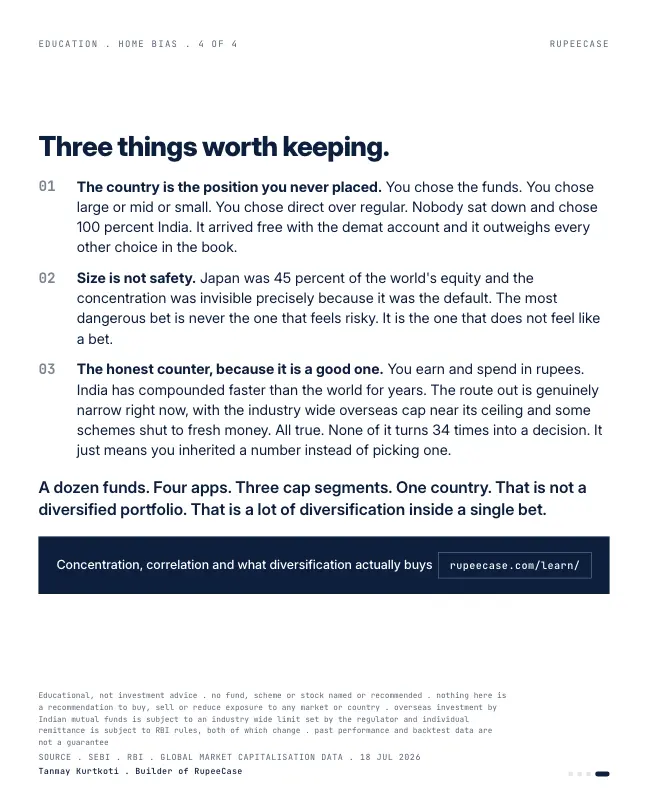
Honest version: I'm not saying sell India. You earn and spend in rupees. India has compounded faster than the world for years. The route out is genuinely narrow right now, with the industry wide overseas cap near its ceiling and some schemes closed to fresh money.
All true. None of it turns 34 times into a decision you made.
A dozen funds, four apps, three cap segments, one country. That is not a diversified portfolio. That is a lot of diversification inside a single bet
The Japan story, in four dates
- Japan is 45 percent of world equity
The largest market on earth, ahead of the US at 33 percent.
- The index peaks at 38,915.87
The last trading day of the year. Nobody marks it as the top.
- Japan's share falls to 8.4 percent
Nearly three decades of a home market that went nowhere in price.
- The 1989 high is finally passed
Thirty four years after the peak.
The lesson is not that India is Japan. It is that the investor in 1989 had no way to know he was living in the first line of that timeline. Size and confidence felt like safety.
Price can stall even in a growing country
A home market can go sideways for long stretches without anything going wrong in the economy, simply because prices had run ahead of earnings. India has a small, recent example. The Nifty 50 closed at 25,127.95 on 14 Oct 2024 and at 22,520.45 on 9 Oct 2026, by NSE data, a fall of 10.4 percent in two years. Over the same two years its price to earnings ratio fell from 23.62 to 19.27. The companies kept earning; investors paid less for each rupee of it.
Nifty 50 price change in two years
NSE closes, 14 Oct 2024 to 9 Oct 2026
Nifty 50 P/E on 14 Oct 2024
NSE index data
Nifty 50 P/E on 9 Oct 2026
NSE index data
Two years is nothing next to thirty four. It is still a reminder that one country's market can spend years repricing, and a portfolio that holds only that market spends those years with it.
The 30 percent sleeve, worked through
The opening's numbers imply two rates. A home market that turns Rs 10 lakh into Rs 10,04,698 in 34 years grew about 0.01 percent a year. For the 30 percent sleeve to bring the total to Rs 61,15,279, the global part has to grow about 8.88 percent a year. At that rate Rs 3 lakh becomes about Rs 54.1 lakh, while the Rs 7 lakh at home becomes about Rs 7.03 lakh.
Run it the other way too. Give home 12 percent and global 8.88 and the sleeve costs a lot of money over 34 years. That is the honest point: a second country is not a bet that it will win. It is insurance against the one outcome that a single country portfolio cannot survive, a home market that stalls for decades.
MythOwning large, mid and small caps across many funds diversifies a portfolio fully.
FactIt diversifies within one market. Every one of those funds shares the same currency, economy and valuation cycle.
The free Learn module on gold, commodities and international investing covers the routes, limits and tax rules for holding assets outside India, with a quiz at the end. The lump sum calculator compounds any amount at any rate. On why the door is narrow right now, read home bias is rationed in India.
Questions readers ask
Is it risky to invest only in India?
It concentrates your portfolio in one economy, one currency and one valuation cycle. That can work well for long stretches, but a home market can also go sideways for years, as Japan's did for 34 years after 1989.
How much of my portfolio should be international?
There is no single right share, and in India the routes are currently limited by the mutual fund industry's overseas ceiling. Many investors decide on a small sleeve first and then fill it as access allows, while keeping most assets in rupees to match their spending.
What is home bias in investing?
It is the tendency to hold far more of your own country's assets than that country's share of world markets. India was about 2.9 percent of world listed equity in the original post, while many Indian portfolios are close to 100 percent India.
The cards
4 cards. Swipe, or tap to open.
Related
- Home bias is rationed in India54 of 66 international funds were closed to fresh money under a 7 billion dollar industry cap set in 2008, so one country concentration is often found rather than chosen.Portfolio construction . . 4 min
- One profile, many goalsPointing one Moderate label at a two year flat deposit and a 25 year retirement pot loses at both ends; the deposit falls short and the far pot ends Rs 24.18 lakh lower.Portfolio construction . . 5 min
- Who sells first: a household's real risk levelA shared portfolio is held by consensus and sold by veto, so the account's risk level is the lower partner's tolerance, not the average.Portfolio construction . . 4 min
Educational content only. Figures are illustrative and computed on historical or representative data for teaching purposes, not investment advice. Past performance does not guarantee future returns. Sourced from NSE, BSE, SEBI, AMFI and RBI public data.