

Company numbers..6 min read
Interest coverage: the number under the profit
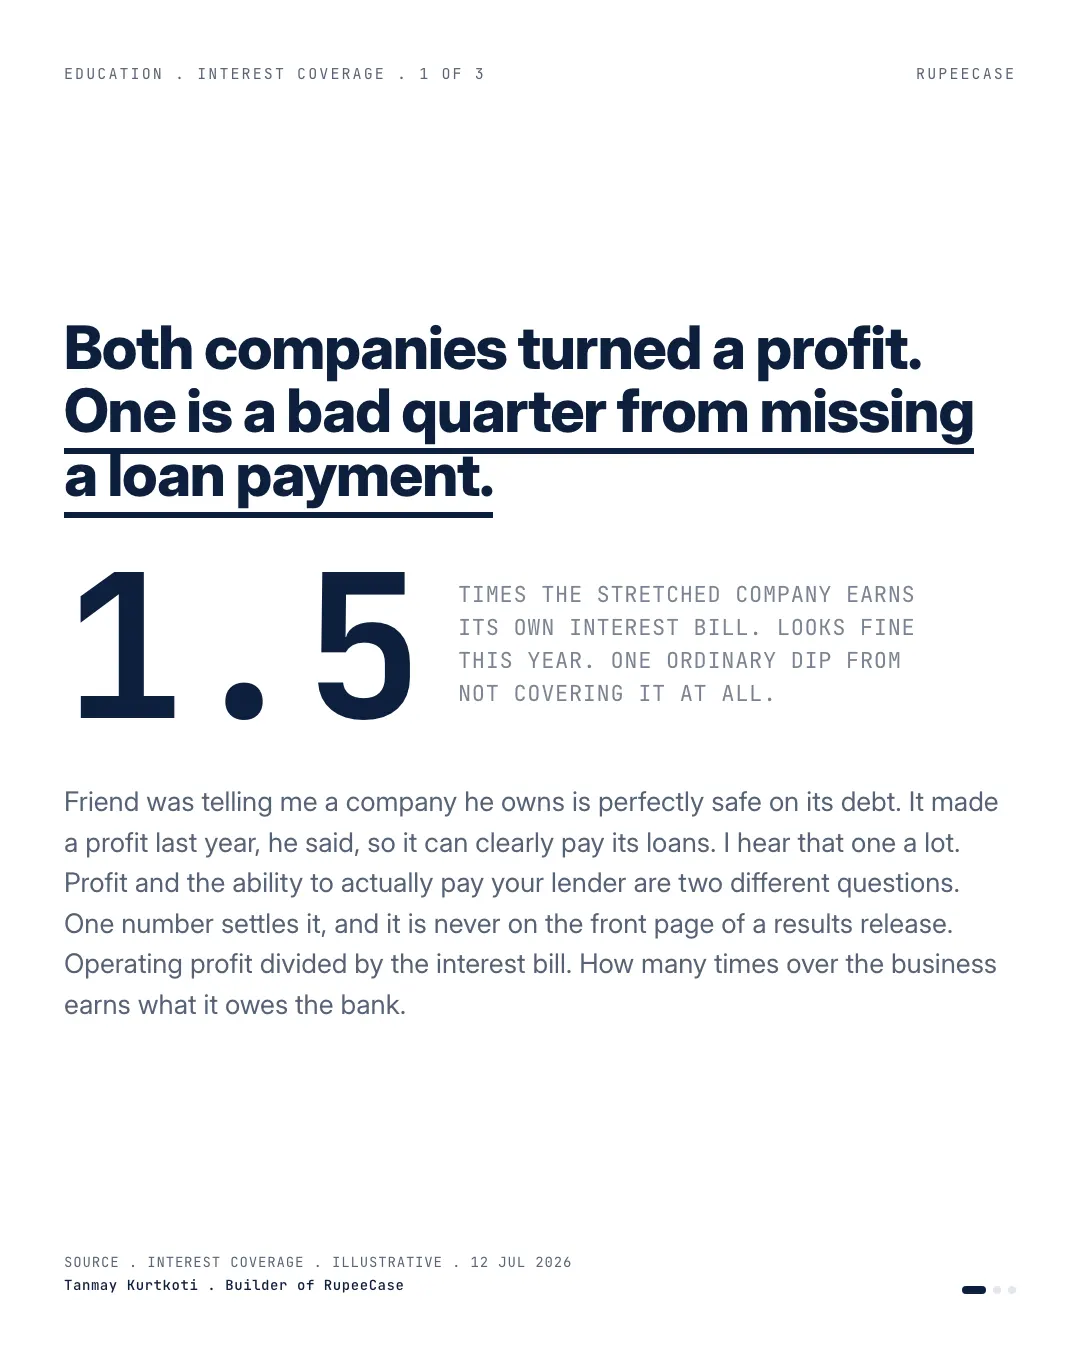
Two companies with the same operating profit cover their interest 5 times and 1.5 times, and a 40 percent bad year leaves one at 3x and the other below 1.
By Tanmay Kurtkoti, founder of QC Alpha and builder of RupeeCase
A friend told me a company he owns is perfectly safe on its debt. It made a profit last year, he said, so it can clearly pay its loans.
I hear that one a lot. Profit and the ability to actually pay your lender are two different questions, and the gap between them is where a lot of apparently healthy companies come undone.
There is one number that settles it, and it is never on the front page of a results release. Operating profit divided by the interest bill. Times interest earned. How many times over the business earns what it owes the bank.
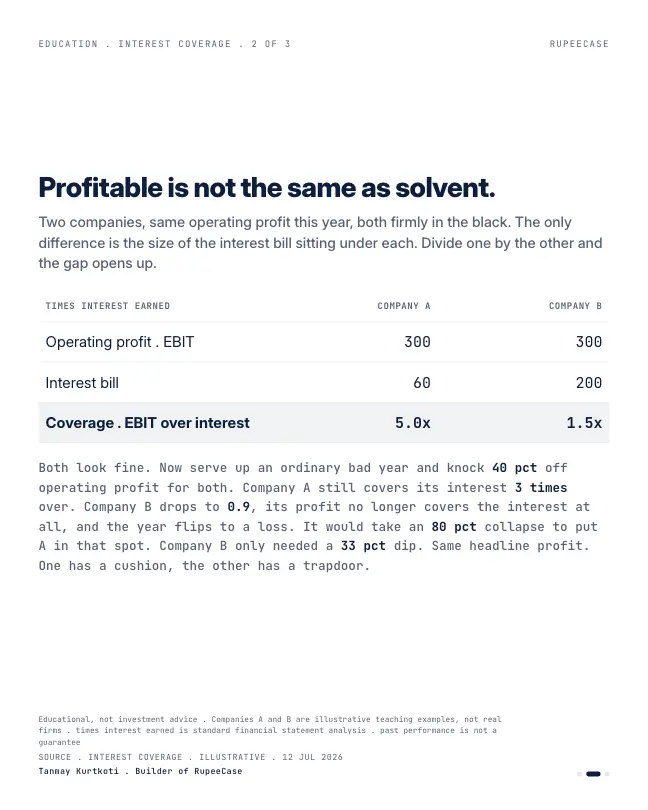
Take two companies. Same operating profit this year, both firmly in the black. Company A owes 60 of interest on a 300 operating profit, so it covers its interest more than 5 times over. Company B owes 200 on the same 300, covering it just 1.5 times. On the P and L they both look fine.
Now serve up an ordinary bad year and knock 40 percent off operating profit for both. Company A still covers its interest 3 times over. Company B drops to 0.9. Its profit no longer covers the interest at all, and the year flips to a loss. It would take an 80 percent collapse to put A there. B only needed a 33 percent dip.
Same headline profit. One has a cushion. The other has a trapdoor.
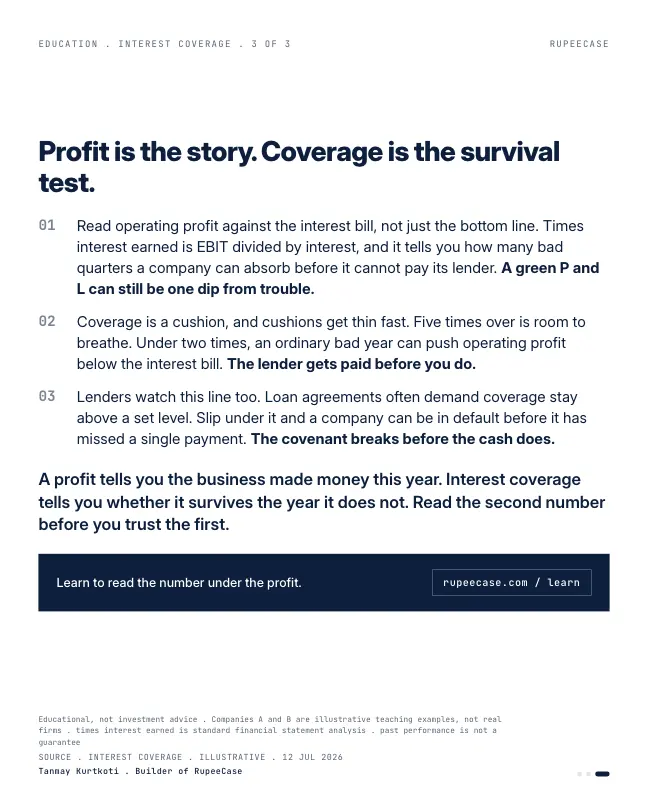
Lenders watch this line too. Loan agreements often require coverage to stay above a set level, so a company can breach its covenant before it has missed a single payment.
Read the number under the profit before you trust the profit
The same two companies, line by line
Put rupees on it so you can redo it on paper. Both companies sell Rs 2,000 crore a year and earn an operating profit (EBIT, earnings before interest and tax) of Rs 300 crore. Company A borrowed Rs 600 crore at 10 percent, so its interest bill is Rs 60 crore. Company B borrowed Rs 2,000 crore at the same 10 percent, so it pays Rs 200 crore.
Walk down the P and L. Company A: Rs 300 crore of operating profit, less Rs 60 crore of interest, leaves Rs 240 crore before tax. Company B: Rs 300 crore less Rs 200 crore leaves Rs 100 crore. Both report a profit. Both can call it a good year. The coverage ratio is the only line that tells you how differently they are built.
Company A: Rs 300 crore profit over Rs 60 crore interest
Worked example, not a company
Company B: same profit over Rs 200 crore interest
Worked example, not a company
Now the bad year. Operating profit falls 40 percent to Rs 180 crore for both. Interest does not fall, because the lender does not share your bad year. Company A: Rs 180 crore less Rs 60 crore is still Rs 120 crore of profit before tax. Company B: Rs 180 crore less Rs 200 crore is a loss of Rs 20 crore. Same sales, same margins, same shock. Only the debt is different.
How far can profit fall before the interest is not covered?
There is a one line formula for the trapdoor. The fall in operating profit that takes coverage to exactly 1 is one minus interest divided by operating profit. For Company A that is 1 minus 60 over 300, which is 80 percent. For Company B it is 1 minus 200 over 300, which is 33 percent. That is where the 80 and the 33 in the opening come from.
Read it the other way and it becomes a stress test. Ask how bad a normal bad year is for this kind of business. A cyclical business can lose a third of its operating profit in one downturn. A company with coverage of 1.5 has no room for that.
Two ways the cushion shrinks
A fall in profit is only half of it. The other half is the interest bill itself. Bank loans are often at floating rates, so when rates rise, the bill can rise with no change in the business.
Run it on Company B. Its Rs 2,000 crore of debt at 10 percent costs Rs 200 crore. If its borrowing rate goes up by 2 percentage points to 12 percent, the bill becomes Rs 240 crore and coverage drops from 1.5 to 1.25, before a single customer has left. Company A on the same rise goes from Rs 60 crore to Rs 72 crore of interest, and coverage moves from 5.0 to about 4.2. Same shock, very different meaning.
- A, normal year5.0x
- A, profit down 40%3.0x
- A, rate up 2 points4.2x
- B, normal year1.5x
- B, profit down 40%0.9x
- B, rate up 2 points1.25x
Interest coverage under each shock. Worked example in Rs crore, not a company.
The free Learn module on leverage reads coverage with the same bands: below 1.5 is survival risk, 2 to 3 is thin, above 5 is comfortable. It also pairs coverage with net debt to EBITDA, because coverage tells you whether this year's profit carries the debt and the debt ratio tells you how big the debt is. You can read it at Leverage, debt and financial risk, with a quiz and a certificate at the end.
Where to find the two numbers
You do not need a data terminal. The quarterly results filing on NSE or BSE has both lines.
- Find profit before taxIt is printed on the results statement every quarter.
- Add back finance costsSchedule III puts interest on its own line, called finance costs.
- Take out other incomeInterest earned on cash is not the business. Strip it to see core operating profit.
- Divide by finance costsThat is coverage. Use the last four quarters added together, not one quarter.
- Stress itKnock 30 to 40 percent off the profit and divide again.
Two cautions. Use four quarters, because one quarter of a seasonal business can make coverage look far better or worse than the year. And look at the trend over three years. A company whose coverage slid from 6 to 4 to 2.5 is telling you its debt is growing faster than its profit, long before any covenant is breached.
The same logic runs through a company's cost structure. Fixed costs make profit swing harder than sales, and interest is the most fixed cost of all. The post on operating leverage shows the sales side of the same trapdoor, and same P/E is not the same price shows why a headline ratio needs a second number beside it.
Questions readers ask
What is a good interest coverage ratio for an Indian company?
There is no single cut off, but a common reading is below 1.5 as survival risk, 2 to 3 as thin, and above 5 as comfortable. Cyclical businesses need more cushion than steady ones, because their operating profit can fall by a third in one bad year. Look at the three year trend as well as the latest figure.
Should I use EBIT or EBITDA for interest coverage?
EBIT is the stricter test because depreciation is a real cost: plant and machinery wear out and must be replaced. EBITDA coverage will always look higher. If a company or a report quotes only EBITDA coverage, work out the EBIT version yourself from the results filing.
Can a profitable company breach a loan covenant?
Yes. Loan agreements often set a minimum coverage level, and a company can fall below it while still reporting a profit and paying every instalment on time. A breach can let the lender raise the rate, demand early repayment or restrict dividends.
The cards
3 cards. Swipe, or tap to open.
Reading path
Stop 6 of 8 on Reading a company
Related
- Operating leverage: the amplifier nobody prices inTwo firms with Rs 200 crore of operating profit on Rs 1,000 crore of sales fall 40 and 20 percent on the same 10 percent revenue drop, depending only on where the costs sit.Company numbers . . 5 min
- Same P/E is not the same priceTwo stocks at a P/E of 20 growing 24 and 8 percent a year carry PEGs of 0.83 and 2.50, and after five years of growth one is twice as expensive as the other.Company numbers . . 5 min
- Goodwill: the asset that exists because they overpaidA Rs 400 crore goodwill write down can turn a 500 crore profit year into 100 without a rupee of cash moving, as Tata Steel's Corus impairment showed.Company numbers . . 5 min
Educational content only. Figures are illustrative and computed on historical or representative data for teaching purposes, not investment advice. Past performance does not guarantee future returns. Sourced from NSE, BSE, SEBI, AMFI and RBI public data.