

Company numbers..5 min read
Same P/E is not the same price
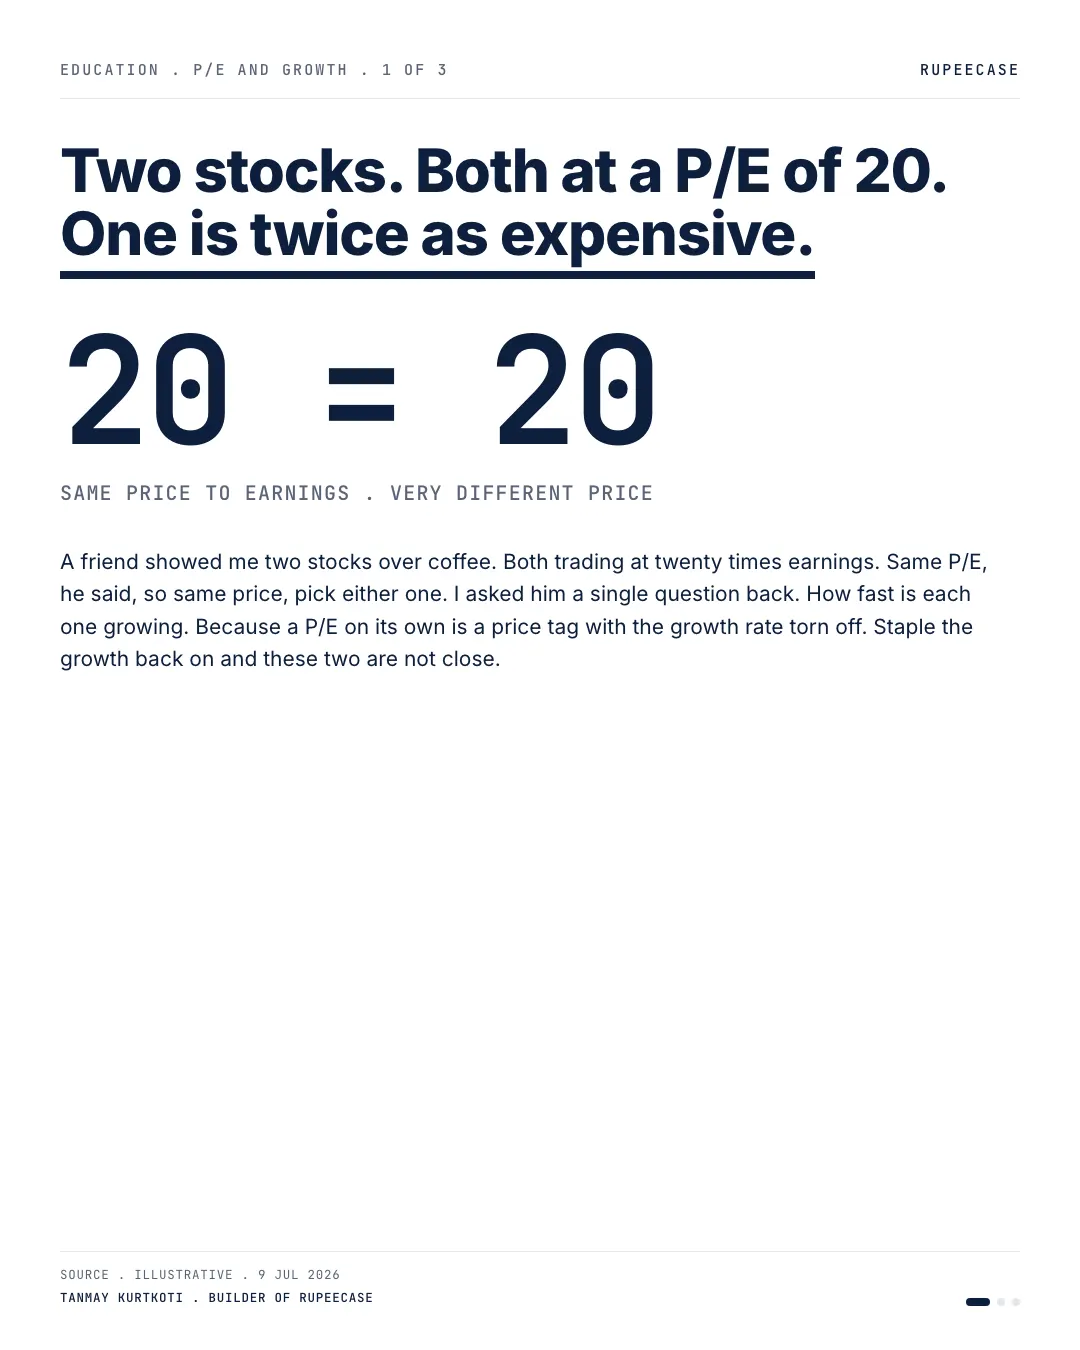
Two stocks at a P/E of 20 growing 24 and 8 percent a year carry PEGs of 0.83 and 2.50, and after five years of growth one is twice as expensive as the other.
By Tanmay Kurtkoti, founder of QC Alpha and builder of RupeeCase
A friend showed me two stocks over coffee last week. Both trading at a price to earnings of 20. Same price, he said. Pick whichever.
I asked him one question. How fast is each one growing.
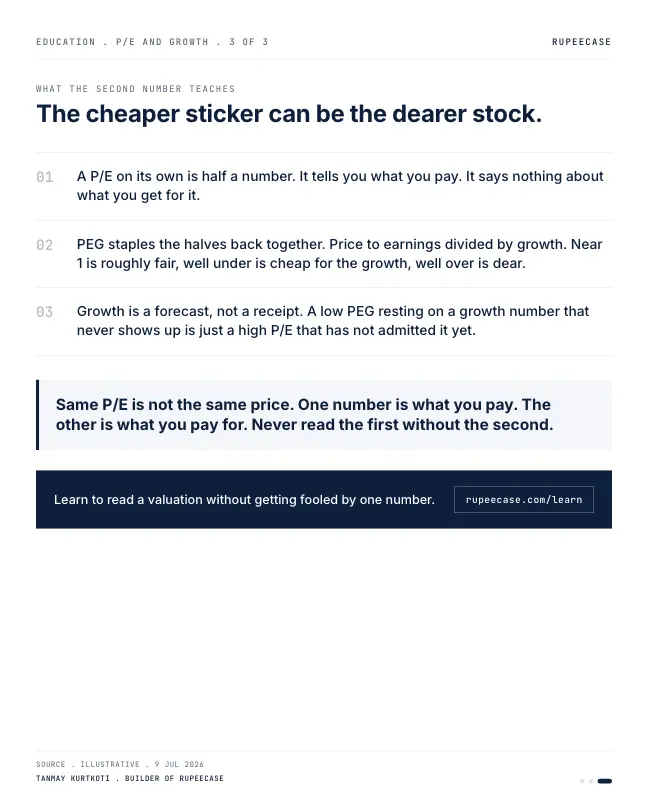
Here is the thing nobody tells you about a P/E. On its own, it is half a number. It tells you what you pay for a rupee of today's earnings. It says nothing about what you actually get for it.
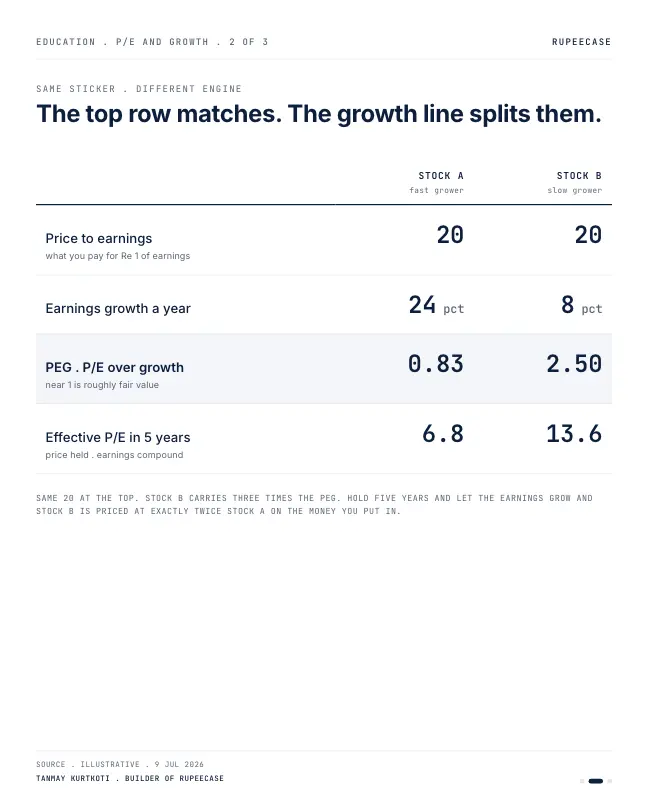
Stock A was growing earnings around 24 percent a year. Stock B, around 8. Divide the P/E by the growth rate and you get what people call PEG. Stock A lands at 0.83. Stock B at 2.50. Same sticker of 20, and Stock B is carrying three times the price per unit of growth.
Then I did the part that makes it real. Hold both for five years and let the earnings compound while the price stays put. The fast grower ends up priced like 6.8 times earnings on the money you put in. The slow one is still sitting at 13.6. Exactly twice as expensive. The two P/Es looked identical the day he showed me. Five years of growth split the value clean in half.
None of this makes a low PEG a free lunch. Growth is a forecast, not a receipt. A cheap PEG resting on a growth number that never shows up is just a high P/E that has not admitted it yet. But that is the point. You cannot even have that conversation while you are staring at a single number.
Same P/E is not the same price. One number is what you pay. The other is what you are paying for. Never read the first without the second.
A P/E moves for two reasons
A P/E is price divided by earnings per share. It can fall because the price fell, or because earnings rose, or both. The ratio alone does not tell you which. The Nifty 50 over the last two years shows both at once.
NSE publishes the index P/E every trading day. Divide the closing level by the P/E and you get the earnings behind the index, in index points. Three dates from that record:
- Nifty 50 at 25,127.95, P/E 23.62
The highest P/E in the two years to Oct 2026. Earnings behind the index: about 1,064 points.
- Nifty 50 at 24,611.10, P/E 21.76
Price down about 2 percent from Oct 2024, earnings up to about 1,131 points.
- Nifty 50 at 22,520.45, P/E 19.27
Earnings up to about 1,169 points. The P/E is near the low of the two year window.
So the index P/E fell from 23.62 to 19.27, an 18.4 percent drop, in two years. Split it. The index level fell 10.4 percent. The earnings under it rose 9.9 percent. Roughly half the fall in the multiple came from a lower price and half from more earnings.
- Index level-10.4%
- Earnings behind the index+9.9%
- P/E-18.4%
14 Oct 2024 to 9 Oct 2026. NSE daily index P/E and closes. Earnings = close / P/E, derived.
That is the friend's two stocks in reverse. On the index, earnings growth did half the work of making it cheaper. In his pair, growth is what makes one of two equal P/Es cheaper over time.
The two stocks, year by year
Put prices on it. Stock A trades at Rs 480 with earnings per share of Rs 24. Stock B trades at Rs 300 with earnings of Rs 15. Both are at 20 times. Now freeze the price and grow the earnings. Stock A's Rs 24 grows 24 percent a year: Rs 29.76, then Rs 36.90, and about Rs 70.36 by year five. Rs 480 divided by Rs 70.36 is 6.8. Stock B's Rs 15 grows 8 percent a year to about Rs 22.04. Rs 300 divided by Rs 22.04 is 13.6.
P/E on today's price falls from 20 to 6.8 for Stock A and from 20 to 13.6 for Stock B over five years.
P/E on today's price, with the price held flat and earnings growing at a steady rate. Worked example, not a company.
The useful way to read the chart: it is the multiple you are really paying on the earnings you will own in each year, if the growth arrives. The price you pay today is fixed. What it buys keeps changing.
Try your own pair
PEG is P/E divided by the growth rate in percent. The five year figure is P/E divided by one plus growth, raised to the fifth power. Both take two inputs you can find in any results filing and a growth estimate you have to make yourself.
Now run the miss. Say Stock A grows 10 percent a year instead of 24. Five years later its P/E on today's price is 12.4, not 6.8. That is barely better than Stock B, and you paid for the 24. This is what the opening means by a growth number that never shows up. The PEG was only as good as the forecast inside it.
Where PEG breaks
Three cases where the ratio misleads. A cyclical company at the top of its cycle shows a low P/E and fast growth, both of which reverse together. A company with growth near zero or negative gives a PEG that means nothing, because you are dividing by almost nothing. And a one time gain inflates this year's earnings, so the P/E looks low and the growth rate looks high for a year. The post on interest coverage shows the same habit for debt: the headline ratio needs a second number beside it.
The free Learn module on reading financial statements builds the P/E from the profit and loss statement up, works it on an example company, and quotes the same Nifty 50 figures. It ends with a quiz and a certificate.
Questions readers ask
What is a good PEG ratio?
A PEG near 1 means the P/E roughly matches the growth rate in percent; below 1 is often read as paying less per unit of growth, above 2 as paying more. The ratio is only as reliable as the growth estimate in it, and it does not work for companies with very low or negative growth.
What is the current P/E of the Nifty 50?
NSE publishes the Nifty 50 P/E every trading day. On 9 Oct 2026 it was 19.27 with the index at 22,520.45, near the low end of the two years from Oct 2024, when it touched 23.62. Check the latest figure on NSE, because it changes daily.
Why can a stock with a high P/E be cheaper than one with a low P/E?
Because the P/E measures today's earnings only. A company growing earnings much faster can see its P/E on today's price fall quickly, while a slow grower stays expensive. Two stocks at 20 times, growing 24 and 8 percent a year, sit at 6.8 and 13.6 times after five years if the growth arrives.
The cards
3 cards. Swipe, or tap to open.
Explore next
Learn it properly, then see it applied.
- GuideNifty PE ratio: what it measures, where it stands, and what it has predictedToday's 19.12 against the range since 2012, and what P/E did and did not predict.
- StrategyAllcap strategyNifty Total Market, 50 stocks, every 2 weeks
- Free module 1.4Reading Financial Statements11 min read
- Blog topicCompany numbers notes24 notes
Related
- Interest coverage: the number under the profitTwo companies with the same operating profit cover their interest 5 times and 1.5 times, and a 40 percent bad year leaves one at 3x and the other below 1.Company numbers . . 6 min
- EBITDA is not profitA 28 percent EBITDA margin became a 3 percent net margin after depreciation, interest and tax, and eight times EBITDA worked out to about 41 times earnings.Company numbers . . 6 min
- Goodwill: the asset that exists because they overpaidA Rs 400 crore goodwill write down can turn a 500 crore profit year into 100 without a rupee of cash moving, as Tata Steel's Corus impairment showed.Company numbers . . 5 min
Educational content only. Figures are illustrative and computed on historical or representative data for teaching purposes, not investment advice. Past performance does not guarantee future returns. Sourced from NSE, BSE, SEBI, AMFI and RBI public data.