

Returns and risk maths..6 min read
Volatility drag: same average, six lakh gap
Two funds printing a 12 percent average return ended at Rs 28.4 lakh and Rs 21.8 lakh on the same Rs 10 lakh, because the drag scales with volatility squared.
By Tanmay Kurtkoti, founder of QC Alpha and builder of RupeeCase
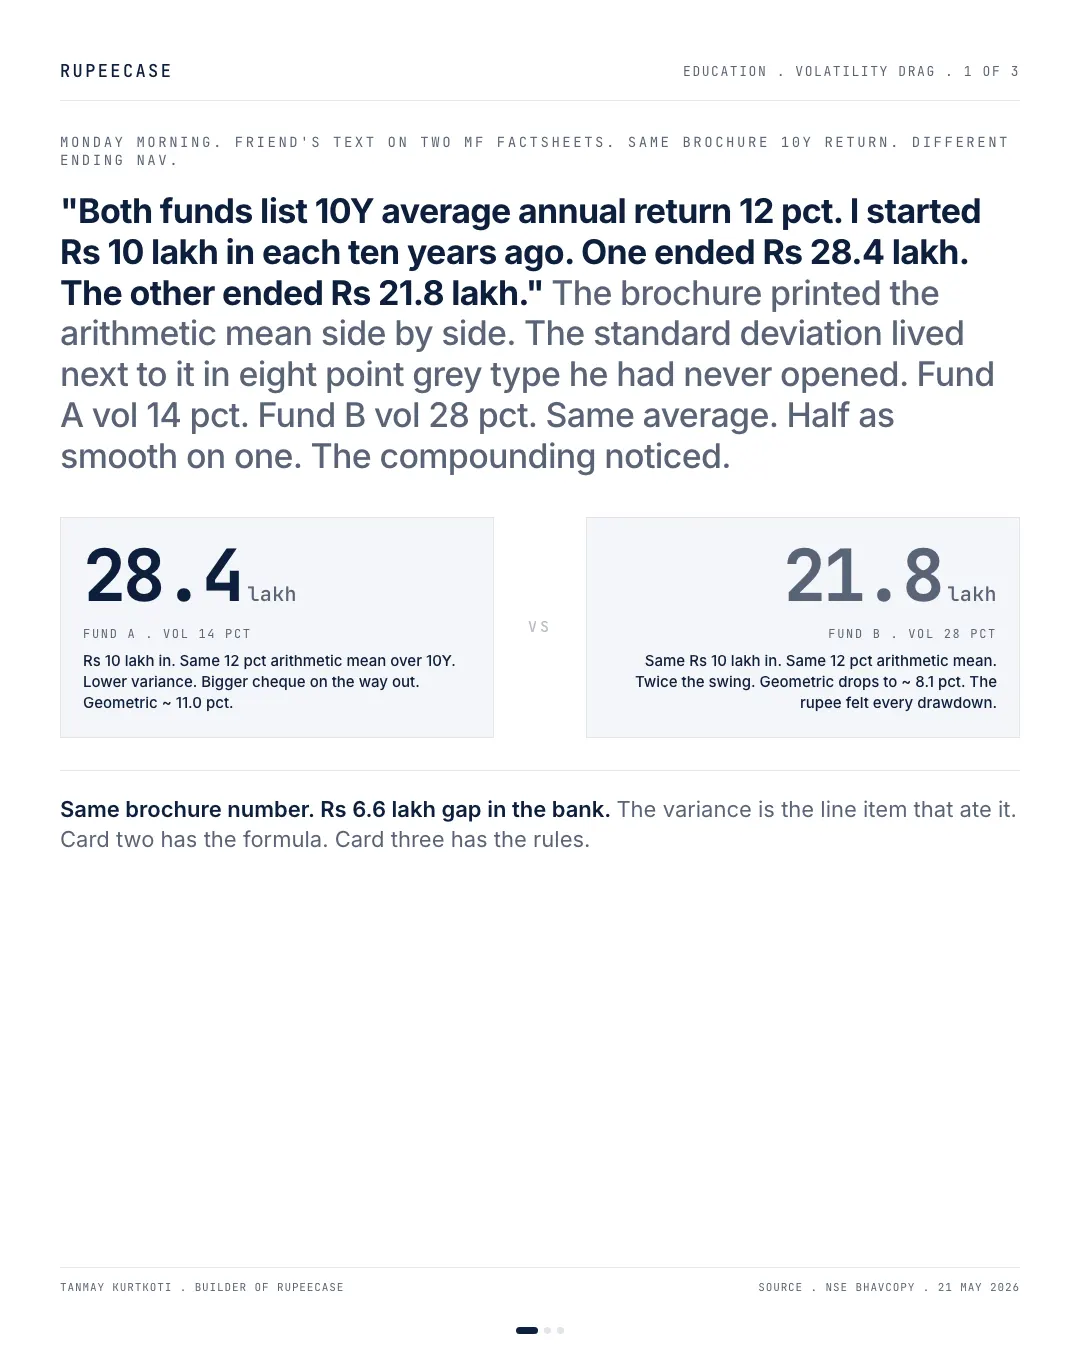
Monday morning. Friend forwards two MF factsheets. Both print "10Y average annual return 12 pct" in big type at the top.
He had run the same Rs 10 lakh through each one ten years ago. One ended at Rs 28.4 lakh today. The other ended at Rs 21.8 lakh. Six lakh gap on the same headline number.
Asked himself the question I would have asked.
The answer was sitting next to the return on the same page, in eight point grey type he had never opened. Standard deviation. Fund A vol 14 pct. Fund B vol 28 pct. Same average, twice the swing on one of them. The compounding noticed, even though the brochure did not say so.
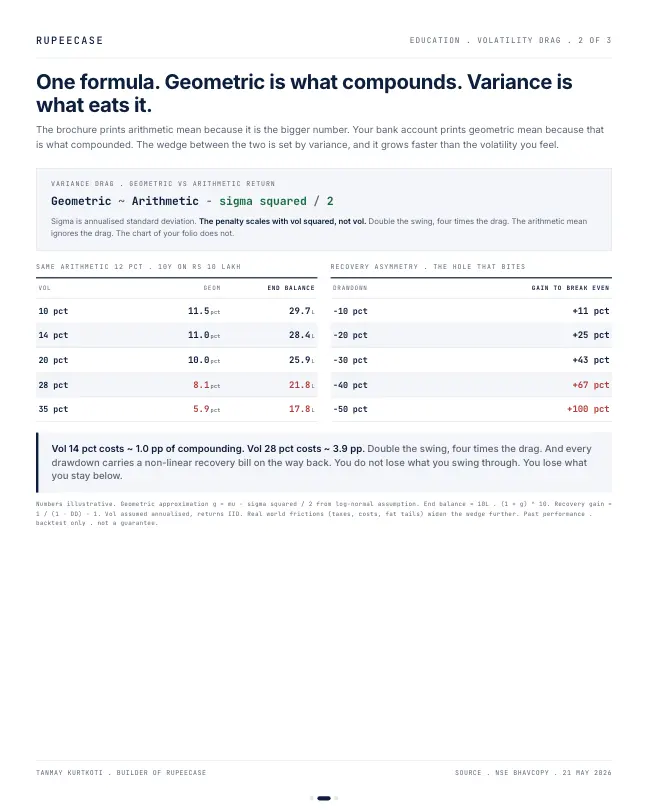
The math is the part most factsheets refuse to print. The geometric return, the one that actually compounds in your account, sits roughly at the arithmetic mean minus sigma squared over two. Vol 14 pct costs about a percentage point of compounding. Vol 28 pct costs almost four. Double the swing, four times the drag. The penalty scales with vol squared, not vol.
The reason is asymmetric recovery. A 10 pct drawdown needs an 11 pct gain to break even. A 20 pct drawdown needs 25. A 30 pct needs 43. A 50 pct needs 100. You do not lose what you swing through. You lose what you stay below. Every deeper hole carries a non-linear bill on the way back, and the variance drag is just that bill aggregated across years.
The brochure prints the arithmetic mean because it is the bigger number. The bank account prints the geometric mean because that is the one that actually compounded. The wedge between them is the price of vol, paid in rupees you never see on a factsheet.
A return without its volatility is half a sentence. Read the other half before you sign the cheque.
The two funds, worked on paper
Here is the arithmetic behind my friend's six lakh gap. You can redo it with a pen.
Both funds average 12 percent a year. The drag is roughly the volatility squared, divided by two. Write the volatility as a decimal first.
Fund A: 0.14 x 0.14 = 0.0196. Half of that is 0.0098, so about 1 percentage point. The rate that compounds is 12 minus 1, about 11 percent a year. Rs 10,00,000 x 1.11 ^ 10 is about Rs 28.4 lakh.
Fund B: 0.28 x 0.28 = 0.0784. Half of that is 0.0392, so close to 4 points. The rate that compounds is about 8.1 percent. Rs 10,00,000 x 1.081 ^ 10 is about Rs 21.7 lakh.
drag a year at 14 percent volatility
Worked example: 0.14 squared, halved
drag a year at 28 percent volatility
Worked example: 0.28 squared, halved
Double the volatility, four times the drag. That is the one line worth remembering from the formula. It is an approximation, and it gets rougher when swings are very large, but it is close enough to explain most of the gap between a brochure average and an account statement.
Move the numbers yourself. Put Fund B's 28 percent in, then halve it, and watch how much of the gap closes.
Why the hole costs more than the hill
The drag is not a quirk of the formula. It comes from the way losses and gains multiply. A fall shrinks the base that the next gain works on, so the climb back is always longer than the fall.
- Fall of 10%11.1%
- Fall of 20%25.0%
- Fall of 30%42.9%
- Fall of 40%66.7%
- Fall of 50%100.0%
Gain needed to break even = 1 / (1 minus the fall) minus 1. Arithmetic, not a forecast.
A portfolio that swings 14 percent a year rarely visits the bottom rows of that chart. One that swings 28 percent visits them often enough that the bill shows up in the compounded rate. That is all the drag is: the recovery cost of every fall, spread across the years.
The same wedge in our own model lines
I wanted to see whether the formula holds on real monthly data, not just on a textbook pair of funds. So I took four of our model curves and compared two numbers for each: the average month, run for twelve months, against the rate the curve actually compounded at. The wedge between them is the drag.
- Nifty 50 EW, vol 13.8%1.06
- Healthcare, vol 21.2%2.52
- Allcap, vol 23.6%3.82
- Energy, vol 29.9%5.59
Gap in percentage points a year, from monthly model curves, Jul 2021 to Jul 2026. RupeeCase lineup.json. Model, back tested, as of 27 Apr 2026.
The order is the order of volatility, almost exactly. The Nifty 50 Equal Weight model swings 13.8 percent a year and loses about 1 point to drag, close to what the formula predicts at that level. The Energy Basket model swings 29.9 percent and loses about 5.6 points. Its file CAGR is 33.12 percent with a maximum drawdown of minus 39.48 percent (Model, back tested, as of 27 Apr 2026). A good number, and still several points below what its average month would suggest.
This is also why I care about drawdown as much as return when I build a strategy at QC Alpha. Lower volatility at the same average is not a comfort feature. It is extra compounding.
How to read a factsheet with this in mind
- Find the returnCheck if it is an average of years or a CAGR. They are different numbers.
- Find the volatilityUsually labelled standard deviation, often in small type near the ratios.
- Square and halve0.20 volatility gives 0.02, about 2 points a year of drag.
- Compare like for likeTwo funds with the same average and different volatility will not end at the same place.
Most fund factsheets print a compounded figure for periods over a year. The trap shows up in brochures, social posts and anything quoting an "average annual return". When you see the word average, ask for the volatility next to it.
The free Learn module on risk metrics that matter covers volatility, drawdown and the ratios built on them, with quizzes and a certificate. The same idea from a different angle is in average return against CAGR.
Questions readers ask
What is volatility drag in simple words?
It is the difference between the average return and the rate your money actually compounds at. Falls shrink the base that later gains work on, so a bumpy path ends lower than a smooth one with the same average. A rough size is volatility squared divided by two: about 2 points a year at 20 percent volatility.
Is a fund with higher volatility always worse?
No. A fund can carry more volatility and still compound faster if its average return is high enough to cover the drag. The point is that two funds with the same average will not end in the same place, so the comparison has to include the swing, not just the headline return.
Where do I find a fund's volatility?
Most mutual fund factsheets print it as standard deviation, usually beside the Sharpe ratio and beta. It is normally an annualised figure based on the last three years of returns. Square it as a decimal and halve it to get a rough sense of the yearly drag.
The cards
3 cards. Swipe, or tap to open.

Explore next
Learn it properly, then see it applied.
- StrategyAllcap strategyNifty Total Market, 50 stocks, every 2 weeks
- CalculatorCAGR calculatorFree, with the formula and a worked example
- Free module 2.3Risk Metrics That Matter8 min read
- CalculatorDrawdown and recoveryFree, with the formula and a worked example
- Blog topicReturns and risk maths notes20 notes
Related
- Average return vs CAGRUp 50 then down 50 averages zero and loses a quarter of the money, and two funds averaging 12 percent at 8 and 30 percent volatility end twenty years at Rs 91 lakh and Rs 42 lakh.Returns and risk maths . . 5 min
- The volatility taxFive portfolios averaging 12 percent compound at 11.98 down to 4.00 percent depending only on volatility, so Rs 10 lakh over twenty years ends anywhere from Rs 96 lakh to Rs 22 lakh.Returns and risk maths . . 9 min
- The average return is a liePlus 30, minus 20, plus 25, minus 15 averages 5.00 percent and compounds at 2.53, and a 12 percent average at 45 percent volatility compounds at 3.93.Returns and risk maths . . 13 min
Educational content only. Figures are illustrative and computed on historical or representative data for teaching purposes, not investment advice. Past performance does not guarantee future returns. Sourced from NSE, BSE, SEBI, AMFI and RBI public data.