

Behaviour..5 min read
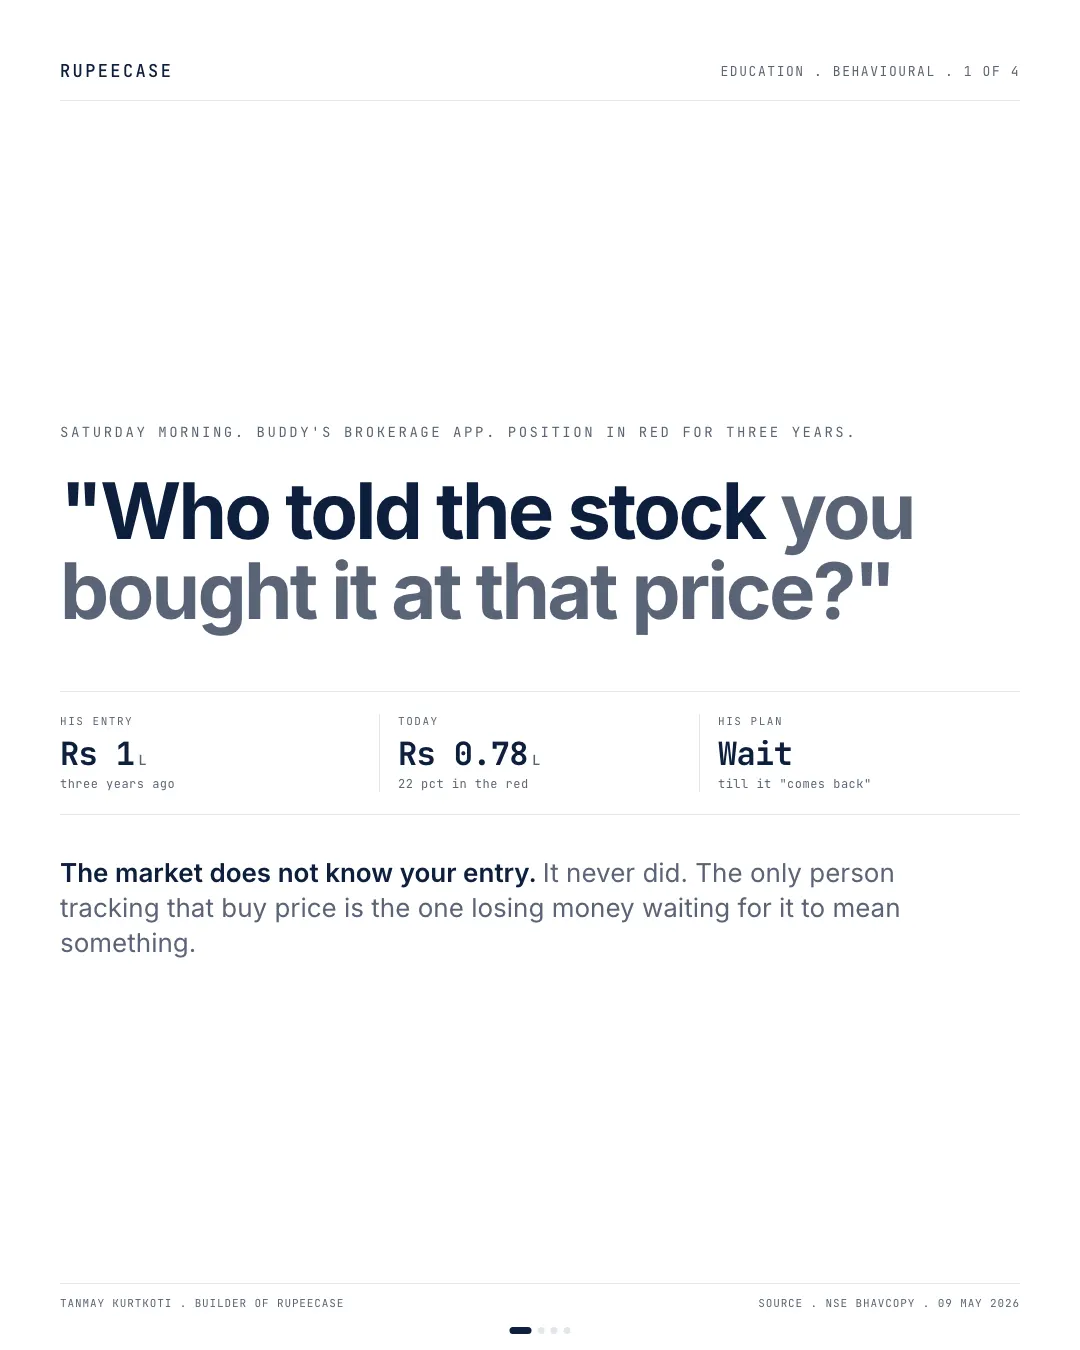
Who told the stock your buy price
Odean's 1998 study found investors cut winners 51 percent faster than losers, and a Rs 1 lakh position left flat for five years forgoes Rs 76,234 of compounding.
By Tanmay Kurtkoti, founder of QC Alpha and builder of RupeeCase
Saturday morning. Filter coffee. My buddy slides his brokerage app across the kitchen counter and shows me a position that has been red for three years.
His plan is to wait. Until it comes back to break even.
I asked him a question that took him a minute to answer. Who told the stock you bought it at that price?
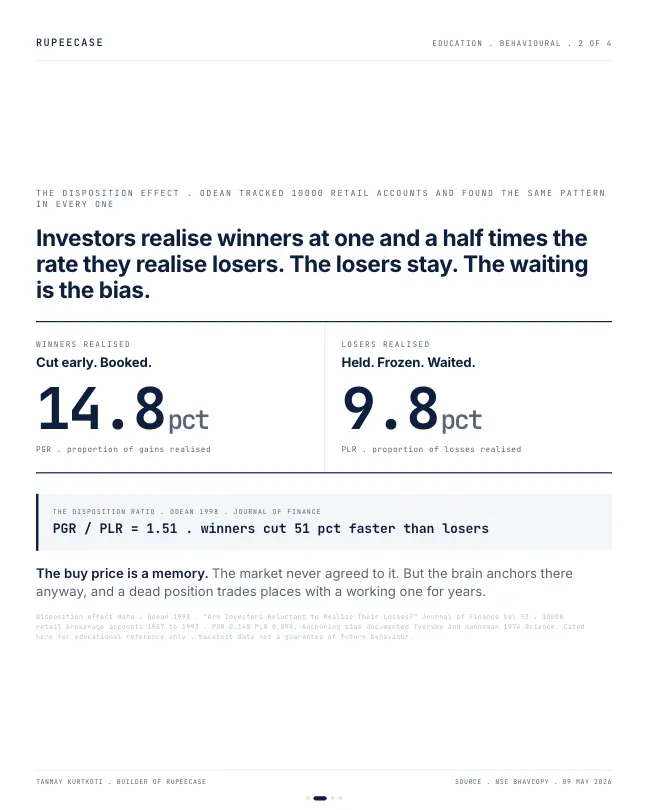
The market never agreed to his entry. It does not even know he exists. The only person tracking that buy price is the one losing money waiting for it to mean something. Behavioural finance has a name for this. The disposition effect. Terrance Odean published it in the Journal of Finance in 1998 after running the data on ten thousand retail brokerage accounts.
Here is what he found. Investors realised gains at 14.8 pct of the time they could have. Realised losses at 9.8 pct. The disposition ratio is 1.51. Winners get cut fifty-one pct faster than losers, across every account, every year, every regime. The brain marks the entry price as a flag. Anything below it feels like an unfinished trade. So the position waits. And rots.
The cost of the rot is the part nobody runs.
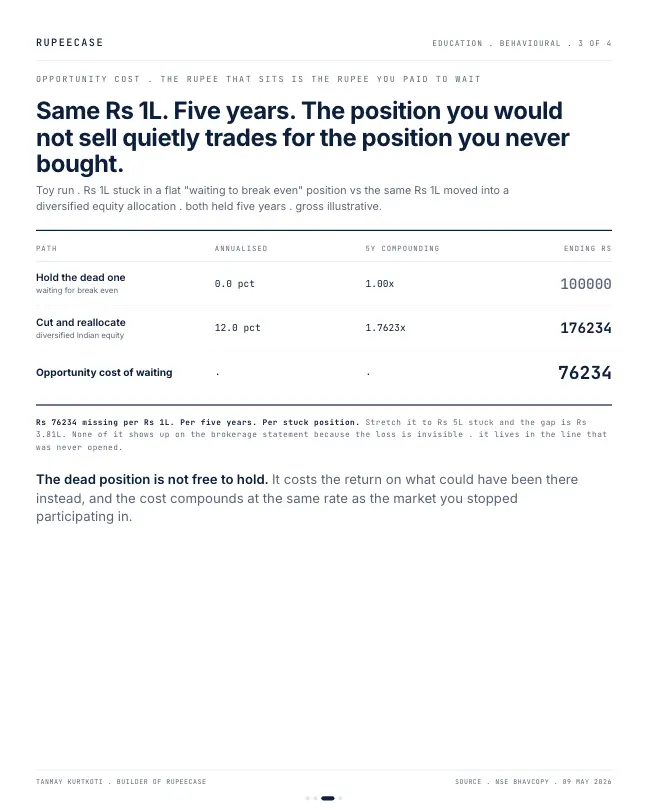
Rs 1L stuck flat for five years stays Rs 1L. The same Rs 1L moved into a diversified equity allocation at 12 pct gross compounds to Rs 1.76L. The gap is Rs 76,234. Per stuck position. Per five years. It is invisible on the brokerage statement because the loss lives in the line that was never opened.
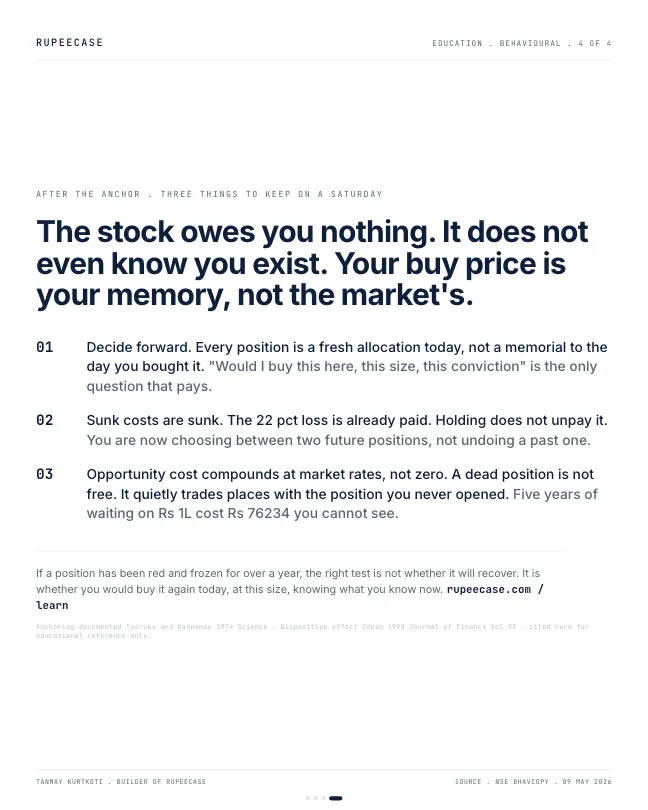
Sunk costs are sunk. The 22 pct loss is already paid. Holding does not unpay it. You are now choosing between two future positions, not undoing a past one.
The honest test for a red and frozen position is not whether it will recover. It is whether you would buy it again today, at this size, knowing what you know now.
If the answer is no, the answer was no a year ago too
How the 14.8 and 9.8 are measured
The two numbers in the opening have a simple recipe, and you can run it on your own account. On every day you sell something, look at every holding you did not sell. Count the winners you could have sold and the losers you could have sold. Then divide.
The share of available gains you actually took is the first number. The share of available losses you actually took is the second. If you treat winners and losers alike, they come out roughly equal. If the first is much larger, the buy price is steering your sells.
- Share of gains realised14.8%
- Share of losses realised9.8%
Odean, Journal of Finance, 1998, 10,000 retail accounts, as quoted in the opening. Ratio 1.51.
A quick version for a ten stock portfolio: in a year you sold 6 of the 30 chances you had to book a gain, and 2 of the 30 chances to book a loss. That is 20 percent against 6.7 percent, a ratio of 3. The bigger the ratio, the more the old entry prices are running the portfolio.
The two views of the same red line
Rs 1,00,000 in, Rs 78,000 now
- Sees a Rs 22,000 hole to fill
- Waits for the old price
- Asks: will it come back?
Rs 78,000 to place today
- The Rs 22,000 is gone either way
- Compares this stock with every other use
- Asks: would I buy it now?
The anchored view treats the Rs 22,000 as something the stock owes you. The fresh view treats Rs 78,000 as cash that happens to be sitting in one stock. Only the second view can be compared with anything else.
- Hide the buy priceLook at today's value, not the profit and loss column.
- Ask the fresh cash questionWould I pick the same stock today, at this size?
- ComparePut it next to the best other use of the same rupees.
- Check the tax lineA booked loss can be set off; a frozen one cannot.
What waiting costs, on your own numbers
The opening priced a flat position against a 12 percent return. Here is the same arithmetic for the red position, so you can change the inputs. The 12 percent is an illustration of a long run equity return, not a forecast. If the stock itself compounds at the same rate, the gap is zero, and the honest question becomes whether you expect that.
The tax line the anchor hides
There is a second cost, and it is written in the Income-tax rules. A loss you book is not only a loss. It can be set off. A short term capital loss can be set off against short term or long term capital gains in the same year. A long term capital loss can be set off only against long term gains. Either can be carried forward for eight years if the return is filed on time.
Put it in rupees. You booked a Rs 22,000 short term gain on another stock this year. Sell the red position inside 12 months and the Rs 22,000 short term loss wipes out that gain. At the 20 percent rate on listed equity for transfers from 23 Jul 2024, that is Rs 4,400 of tax you do not pay. Hold past 12 months and the loss turns long term, usable only against long term gains, which are taxed at 12.5 percent above Rs 1.25 lakh a year. The anchor does not only cost compounding. It can cost the set off too.
The free Learn module on the disposition effect and how to beat it has the full measurement, the research and a set of rules with a quiz. The related post on mental accounting covers the same brain bug from the spending side.
Questions readers ask
What is the disposition effect in investing?
It is the habit of selling winners too early and holding losers too long. In Odean's 1998 study of 10,000 accounts, investors took 14.8 percent of the gains available to them and only 9.8 percent of the losses, a ratio of about 1.5.
Can I set off a loss on shares against other gains in India?
Yes, within capital gains. A short term capital loss can be set off against short term or long term capital gains, while a long term loss can be set off only against long term gains. Unused losses can be carried forward for eight years if the return is filed by the due date.
Should I wait for a stock to return to my buy price?
The buy price has no effect on what the stock does next. A fairer test is whether you would buy the same stock today, at the same size, with fresh cash. If not, the cost of waiting is the return the money could earn elsewhere plus any tax set off you give up.
The cards
4 cards. Swipe, or tap to open.
Explore next
Learn it properly, then see it applied.
- Free module 8.1Why Investors Lose, Introduction to Behavioural Finance11 min read
- StrategyAllcap strategyNifty Total Market, 50 stocks, every 2 weeks
- Free module 8.5The Disposition Effect and How to Beat It9 min read
- CalculatorLumpsum calculatorFree, with the formula and a worked example
- Blog topicBehaviour notes27 notes
Related
- Mental accounting: the bonus that feels differentThaler's mental accounting explains why a Diwali bonus gets spent and a salary SIP never misses, and a Rs 2 lakh splurge carries a thirty year bill of about Rs 60 lakh.Behaviour . . 5 min
- Recency bias meets factor crowdingA model basket up 60 percent on a trailing return screen is a momentum tilt with a friendly name, and the same factor has lost 28, 21 and 19 percent in its three crashes.Behaviour . . 6 min
- Sunk cost: the first loss is the cheapestA 35 percent hole needs 54 percent to climb out, and a Rs 65,000 rump held flat for three years forgoes about Rs 30,000 against cutting and redeploying at the index.Behaviour . . 5 min
Educational content only. Figures are illustrative and computed on historical or representative data for teaching purposes, not investment advice. Past performance does not guarantee future returns. Sourced from NSE, BSE, SEBI, AMFI and RBI public data.