

Behaviour..6 min read
Stops set by feel, not by math
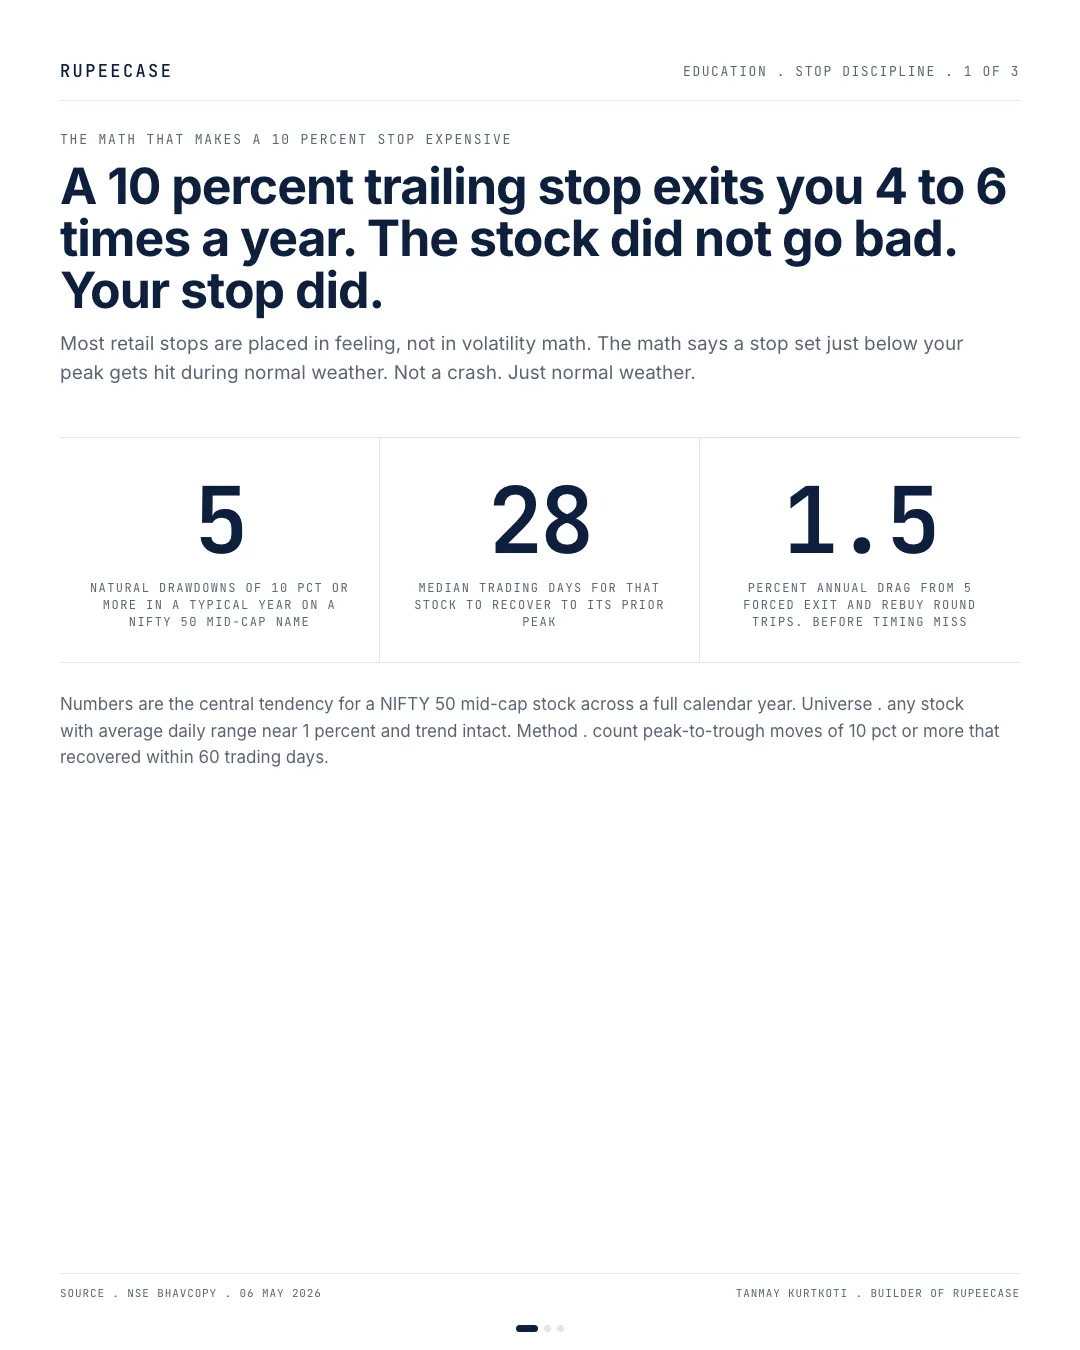
A 10 percent trailing stop on an ordinary large cap gets hit four to six times a year by normal weather, and each forced round trip costs about 0.30 percent.
By Tanmay Kurtkoti, founder of QC Alpha and builder of RupeeCase
Friend texted me last week. He had been holding a name for two years. Got stopped out on a Tuesday at the recent low. The stock closed Friday back above his original entry. He asked the obvious question. How do I avoid this.
We pulled the volatility numbers together. He had set a 10 pct trailing stop just below the recent high. He thought he was being prudent. The math said his stop was sitting inside the third standard deviation of normal weather on that stock. Translated . normal weather was going to look like a crash to that stop, and it was going to keep happening to him until the stop changed.
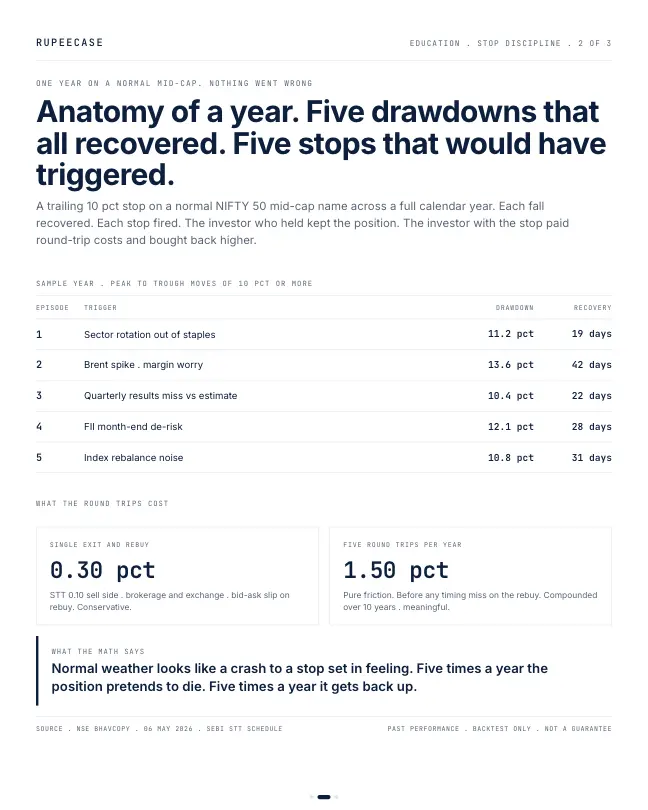
Here is the part most people do not see. A typical NIFTY 50 mid-cap name has an average daily range close to 1 pct. Across a full calendar year that volatility produces 4 to 6 episodes where the stock falls 10 pct or more from a recent peak and then quietly recovers inside about a month. Nothing actually went wrong with the underlying business in those episodes. Sector rotation. A Brent spike. A quarterly miss vs the estimate. A month-end FII de-risk. An index rebalance noise day. Five different stories. Same shape on the chart. Same outcome on the stop.
Now price the round trips. Each forced exit and rebuy costs roughly 0.30 pct after STT, brokerage, and the bid-ask slippage you pay on the way back in. Five round trips a year is 1.50 pct of pure friction. Before any timing miss on the rebuy. Across 10 years on a multi-lakh corpus, that is more than two full years of returns gone to whichever stop felt safe at the time of setting it.
The behaviour underneath this is universal. We anchor stops to round numbers near recent peaks because the round number feels like the floor and the recent peak feels like the cliff. Neither feeling has anything to do with the volatility of the stock. The volatility math does not care that 10 is a tidy number. The plain-English drawdown and stop-discipline modules with worked numbers are at rupeecase.com/learn/
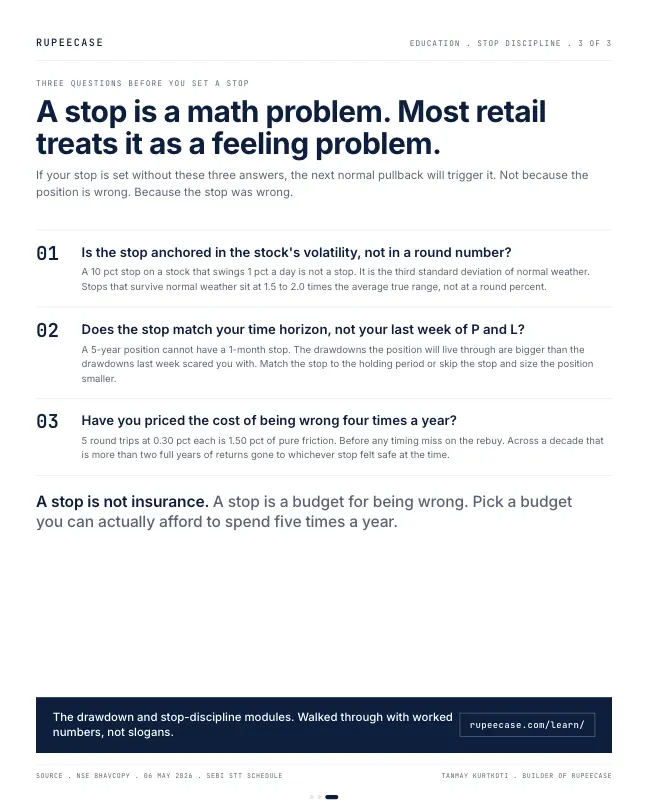
A stop is a math problem. Most retail treats it as a feeling problem. The three honest questions are simpler than they look. Is the stop anchored in the stock's volatility, not in a round percent. Does the stop match your holding period, not last week of P and L. Have you priced the cost of being wrong four times a year before you set it once.
Match all three and the stop earns its place. Skip any one and the stop is a budget for friction the brokerage will be happy to collect. The risk profile that tells you whether you should be running stops at all on this position lives at rupeecase.com/risk-profile
A stop is not insurance. A stop is a budget for being wrong. Pick a budget you can actually afford to spend five times a year.
I ran the same test on the index itself
A single stock is noisier than an index, so the cleanest test is the calmest thing on the screen: the Nifty 50. I took NSE's daily closes from 14 Oct 2024 to 9 Oct 2026, 493 trading days, and set a simple trailing stop. Sell when the close falls a set percent below the highest close since you bought. Buy back when the close gets above the price you sold at.
one standard deviation of a Nifty 50 day
NSE closes, Oct 2024 to Oct 2026
the same, scaled to a year
NSE closes, Oct 2024 to Oct 2026
trading days in the test
NSE closes, Oct 2024 to Oct 2026
- 3% trailing stop11
- 5% trailing stop11
- 10% trailing stop3
Stop outs on the Nifty 50, 14 Oct 2024 to 9 Oct 2026, buying back above the exit price. NSE bhavcopy closes. Price index, no costs.
Eleven exits in two years on the most diversified index in the country, with a 3 percent stop. Even at 10 percent, the index sold you out three times. A single stock carries more risk than the index because it carries its own news on top of the market's, so the counts on one name are higher, not lower. That is the friend's Tuesday, repeated.
Price the stop before you set it
Each of those exits is a round trip. On a delivery trade the statutory part alone is about 0.22 percent: STT of 0.1 percent on the buy and on the sell, stamp duty of 0.015 percent on the buy, and NSE and SEBI charges of a few rupees per lakh. Brokerage and the spread come on top, which is how the opening gets to roughly 0.30 percent. Five stop outs a year at that rate is a 1.5 percent yearly drag before you count the rebuy at a higher price.
So the stop has a budget, and the budget is set by how often it fires. A stop that fires five times a year on a Rs 5,00,000 position costs about Rs 7,500 a year in friction alone. That is a figure you can decide to pay. Most people never see it, because it arrives as five small contract notes instead of one bill.
Set the width from the stock, not from a round number
The honest version of rule one is arithmetic. A stock's typical move grows with the square root of time. If a stock moves about 1.7 percent on a normal day, one standard deviation over 20 trading days is about 1.7 times the square root of 20, or 7.6 percent. A stop at 10 percent below the high sits only a little more than one of those away. Normal weather will reach it.
A 15 percent stop on a Rs 5,00,000 position risks Rs 75,000. If that is too much, the honest fix is a smaller position, not a tighter stop. That is the whole job of position sizing: pick the stop from the stock, then pick the size from the rupees you can lose. The position size calculator does that arithmetic for any stop and any risk budget.
- MeasureDaily volatility of this stock, not a rule of thumb.
- MatchScale it to the holding period you actually intend.
- PriceCount the round trips the stop will trigger in a normal year.
- SizeSet the position so the stop loss is a sum you can afford.
The free Learn module on risk management for systematic portfolios covers stops, drawdown budgets and sizing with worked numbers. The companion post on the stop loss that did not stop looks at the other failure: a gap through the stop price.
Questions readers ask
How wide should a stop loss be?
Wide enough that the stock's normal movement over your holding period does not reach it. A stock that moves about 1.7 percent a day has a one standard deviation move of about 7.6 percent over 20 trading days, so a stop at two standard deviations sits about 15 percent below the high.
Why does my stop loss keep getting hit before the stock recovers?
Because the stop is inside the stock's normal range. On NSE closes from Oct 2024 to Oct 2026, even the Nifty 50 index hit a 3 percent trailing stop 11 times and a 10 percent stop 3 times. Single stocks move more than the index.
How much does a stop loss round trip cost in India?
The statutory charges on a delivery round trip are about 0.22 percent: STT on both sides, stamp duty on the buy and small NSE and SEBI fees. Brokerage, GST and the bid ask spread add to that, which takes a typical round trip to around 0.30 percent.
The cards
3 cards. Swipe, or tap to open.
Explore next
Learn it properly, then see it applied.
- GuideStop loss for long term investors: a trailing stop tested on the Nifty 50 since 2012A trailing stop tested on every Nifty 50 close since 2012: what it saved and what it cost.
- Free module 8.1Why Investors Lose, Introduction to Behavioural Finance11 min read
- StrategyAllcap strategyNifty Total Market, 50 stocks, every 2 weeks
- CalculatorDrawdown and recoveryFree, with the formula and a worked example
Related
- A stop loss is not a floor. It is a request.A stop is a trigger plus whatever fill exists, and in a 20 percent gap a 5 percent stop left 75 percent of the damage uncontrolled while circuit rules queued the exit.Behaviour . . 13 min
- FII flow is a sentence, not a verdictFII sold Rs 1.92 lakh crore of Indian equity in four months of 2026 while the Nifty sat 7.6 percent off its high, because DII and the SIP book were the bigger buyer.Behaviour . . 5 min
- Who told the stock your buy priceOdean's 1998 study found investors cut winners 51 percent faster than losers, and a Rs 1 lakh position left flat for five years forgoes Rs 76,234 of compounding.Behaviour . . 5 min
Educational content only. Figures are illustrative and computed on historical or representative data for teaching purposes, not investment advice. Past performance does not guarantee future returns. Sourced from NSE, BSE, SEBI, AMFI and RBI public data.