

Behaviour..5 min read
Myopic loss aversion: the price of looking
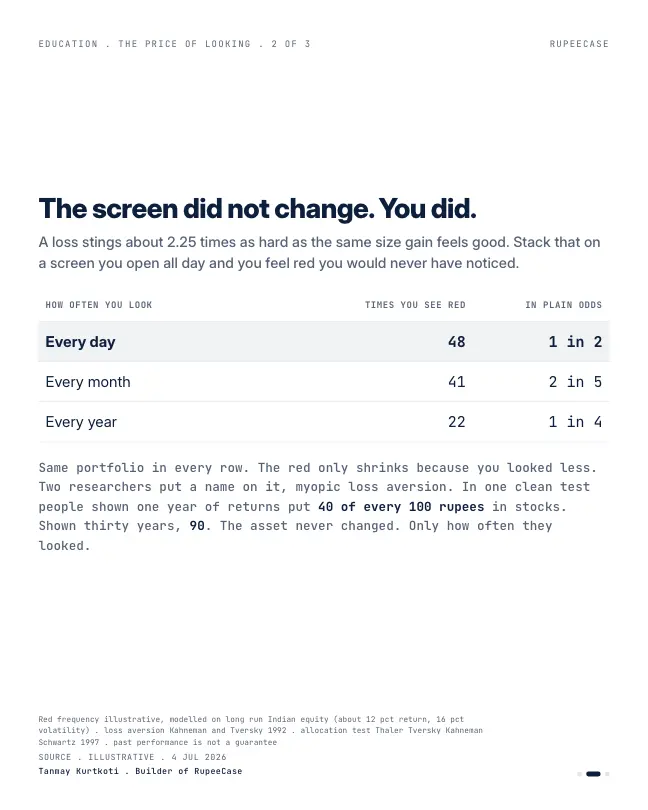
An index that climbs over the long run still closes red almost half of its days, about 2 in 5 months and 1 in 4 years, and a loss stings about 2.25 times a gain.
By Tanmay Kurtkoti, founder of QC Alpha and builder of RupeeCase
A friend refreshes his holdings app maybe ten times a day.
I check mine about twice a year. We own the same fund. He is miserable and I am fine, and for a while I could not work out why the same portfolio was doing that to him and not to me.
So I pulled the numbers.
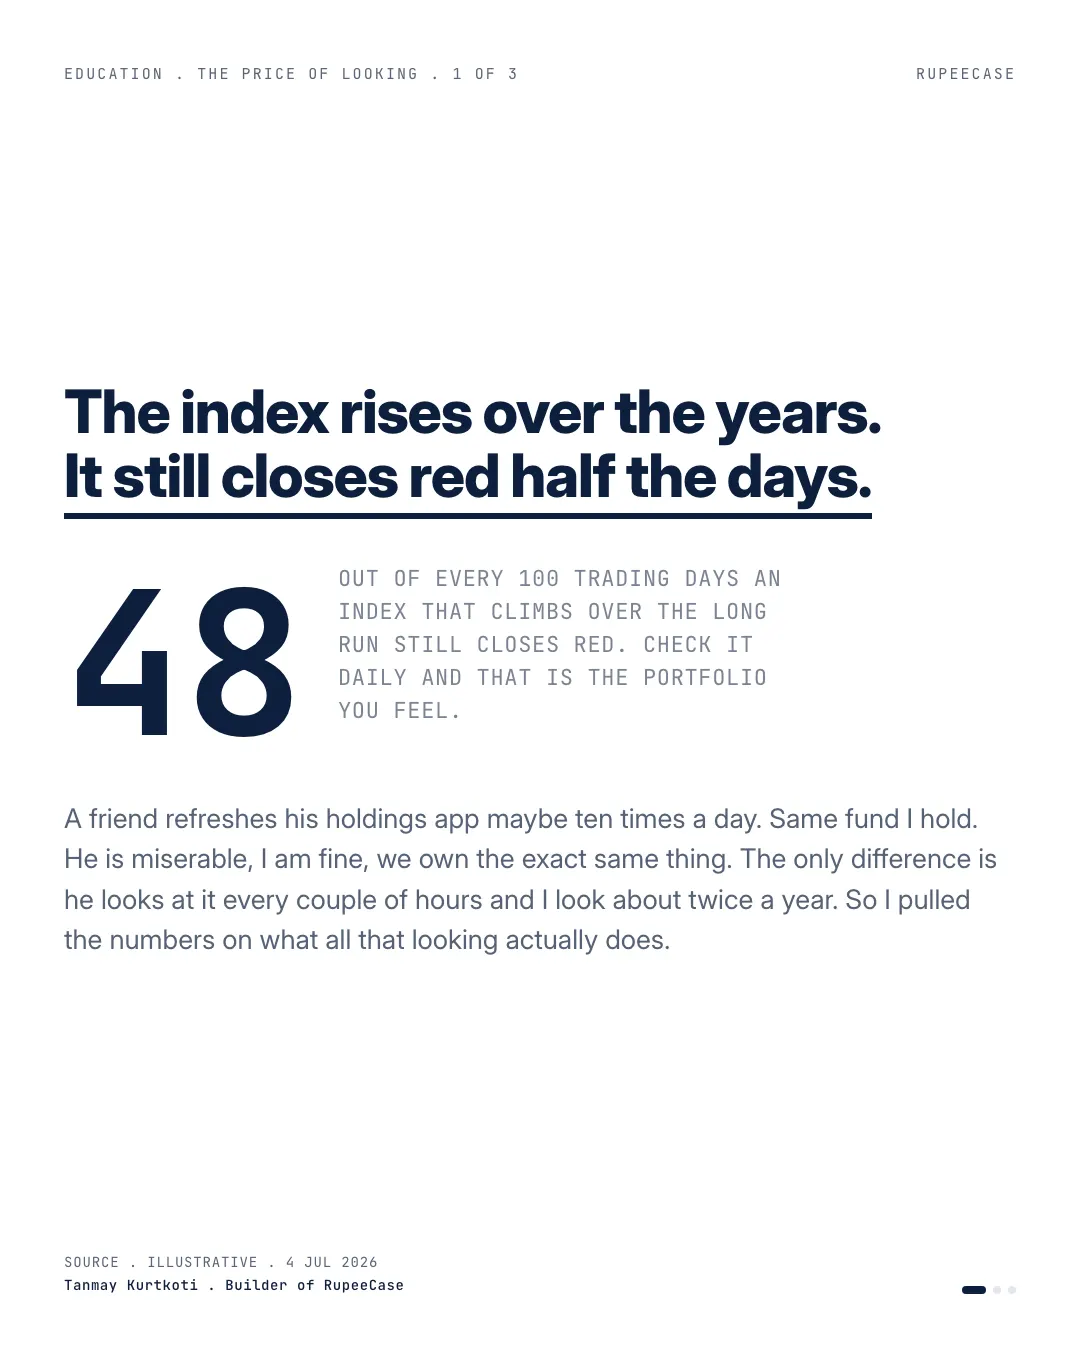
Here is the part nobody tells you about an index that climbs over the long run. It still closes red almost half the trading days. Look at it every day and that is what you feel, a coin flip that is usually against you. Stretch the lens to a month and the red drops to about 2 in 5. Stretch it to a full year and it is about 1 in 4. The portfolio did not change. The only thing that changed was how often you opened it.
Now stack one more fact on top. A loss stings about 2.25 times as hard as the same size gain feels good. That is not a saying, it has been measured. So a screen you check all day does not feel neutral even when the market is up more often than not. You feel every red print at double weight and the green ones barely register.
Shlomo Benartzi and Richard Thaler gave it a name. Myopic loss aversion. In one clean test, people shown one year of returns put 40 percent of their money in stocks. People shown thirty years put 90. Same asset. The only variable was how often they looked.
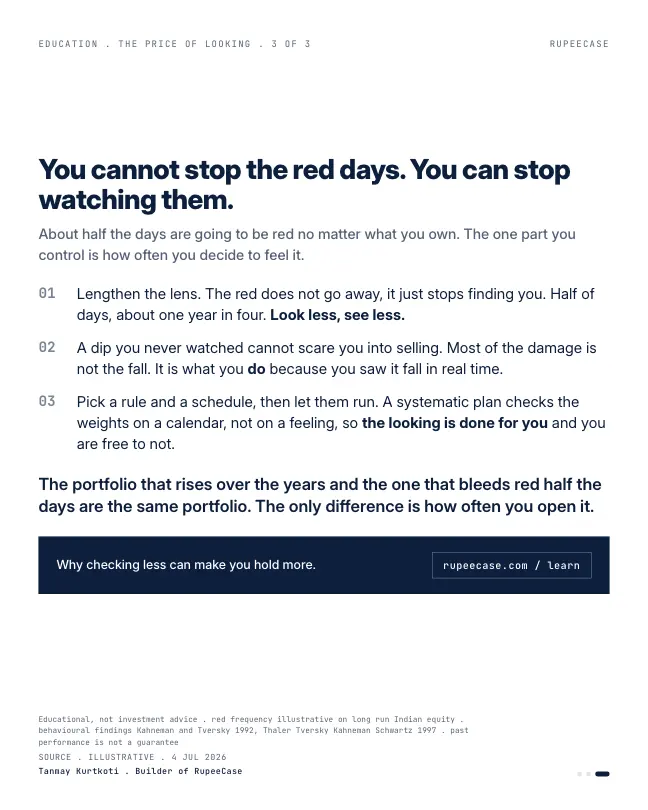
You cannot stop the red days. About half of them are coming no matter what you own. The part you control is how often you decide to feel it. Pick a rule, put it on a schedule, and let it check the weights so you do not have to.
The looking is the tax. Most of us pay it ten times a day
The same idea on a rule that went up
The opening's pattern needs one condition: the thing you own has to rise over the long run. To show it on numbers I can publish, I took the Nifty 50 Equal Weight model from our own lineup, the simplest rule we run, and counted how often it was red over each lens, using month end values from the back test.
- Red months36.7%
- Red quarters29.3%
- Red 12 month windows6.1%
- Red 3 year windows0.0%
Nifty 50 Equal Weight model, month end values from Jul 2021 to Apr 2026, rolling windows. Model, back tested, as of 27 Apr 2026. RupeeCase lineup.json.
More than a third of the months were red. Almost none of the 12 month windows were, and none of the three year windows. A person who looked once a month felt a loss in about 1 of every 3 looks. A person who looked once a year felt one in about 1 of every 16. Same rule, same rupees.
And on two years that went nowhere
The opening is honest about one thing that is easy to skip: the lens only helps when the long run goes up. The last two years on the actual index were a hard test. On NSE's daily closes the Nifty 50 went from 25,127.95 on 14 Oct 2024 to 22,520.45 on 9 Oct 2026.
of trading days closed red
NSE, Nifty 50, 493 days to 9 Oct 2026
of rolling one month windows were red
NSE, Nifty 50, Oct 2024 to Oct 2026
of rolling one year windows were red
NSE, Nifty 50, Oct 2024 to Oct 2026
In a stretch where the index ends lower, looking less does not make the red go away. What it still does is cut the number of times you feel it. Checking daily over those two years meant 255 red screens. Checking at each month end meant 14 red screens out of 24. The loss was the same either way. The number of painful moments was not.
Put a price on the looking
Here is the opening's arithmetic as a small tool. Each look is red with some probability, and each red look counts at 2.25 times the weight of a green one. The output is a rough count of how the year feels, not of how it went.
At 250 looks a year with 48 percent red, the felt score is about minus 140, even though green days outnumber red ones. At 12 looks with 37 percent red, it is close to even, about minus 2. Nothing about the investment changed. Only the sampling did.
A schedule instead of a refresh button
- Pick the dateOne fixed review day a quarter, or the rule's own rebalance date.
- Check the weightsIs the mix still where the plan says? That is the only question.
- Act by ruleRebalance if a band is breached; otherwise close the app.
- Ignore the restDaily moves are noise for a goal that is years away.
That is what the opening means by letting the rule check the weights. The free Learn module on loss aversion covers prospect theory, the 2.25 figure and how investors can design around it. The post on fund return against investor return shows what the habit costs in rupees when looking turns into acting.
Questions readers ask
How often should I check my portfolio?
Checking more often does not change the result, only how often you see a loss. In our Nifty 50 Equal Weight model back test, 36.7 percent of months were red but only 6.1 percent of 12 month windows (Model, back tested, as of 27 Apr 2026). Many investors tie the check to a fixed review or rebalance date.
What is myopic loss aversion?
It is Benartzi and Thaler's term for the mix of feeling losses more than gains and looking at returns too often. Frequent looks show more red periods, each red look hurts more than a green one pleases, and investors end up holding less equity than their horizon allows.
What share of days does the Nifty 50 fall?
It depends on the period. Over 493 trading days from 14 Oct 2024 to 9 Oct 2026, a weak stretch in which the index ended lower, the Nifty 50 closed down on 51.7 percent of days.
The cards
3 cards. Swipe, or tap to open.
Related
- Your portfolio is not down. You are looking too often.At 12 percent drift and 18 percent volatility a day's wobble is 24 times the signal, a normal year shows about 121 red days, and the crossover sits at 2.25 years.Behaviour . . 14 min
- The behaviour gap: fund return vs investor returnIndian equity funds returned 19.1 percent a year from 2003 to 2022 while the rupees investors actually put in earned 13.8, and SIP investors earned 15.2.Behaviour . . 5 min
- Risk tolerance is a moodGuiso, Sapienza and Zingales found risk aversion rose sharply after 2008 on fear rather than wealth, so ask the drawdown question in rupees, not percentages.Behaviour . . 5 min
Educational content only. Figures are illustrative and computed on historical or representative data for teaching purposes, not investment advice. Past performance does not guarantee future returns. Sourced from NSE, BSE, SEBI, AMFI and RBI public data.